Concentration determination by means of refractive index
Introduction
Solvent concentration influences the sample in many ways, e.g. with regard to electrical conductivity, pH-value, stability, and even color intensity. That’s why for many products, such as soft drinks, it is necessary to determine the concentration of single components.
Several measurement principles are used to determine the concentration of binary and quasi-binary solutions. They are based on physical principles like density, refractive index or chemical reaction / interaction, e.g. for titration. Depending on the applicative situation, the best solution can be found by recognizing the advantages of these techniques, e.g. accuracy or measurement cycle speed.
Refractive index and concentration
Principle
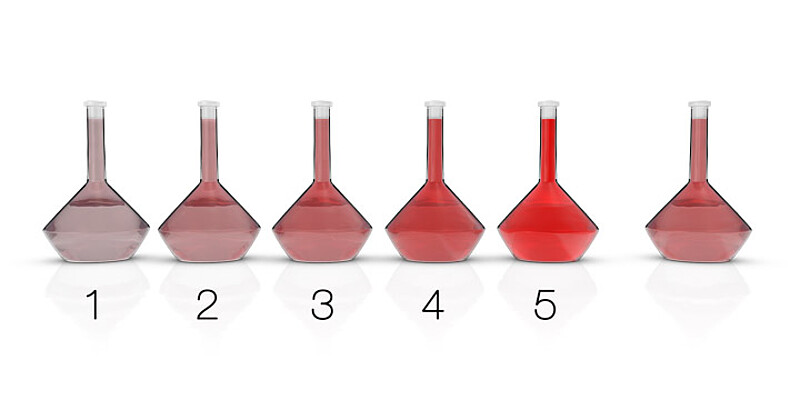
The refractive index is described as the speed of light in a medium compared to the speed of light in the vacuum. To obtain a better picture about its influence, it is possible to assume: The more particles or molecules, the slower light travels. Therefore, a water solution with no particles has a lower refractive index than a solution with 10 g of sugar content inside which light travels more slowly.
For this reason, the refractive index can be used either to determine a substance or to correlate its value with a concentration of particles – so the relationship between refractive index and concentration is crucial. Its influence is already used for a range of applications, e.g. the determination of sugar content or sodium hydroxide in water. Unfortunately, this relation is not linear and depends on the solvent as well as on the particles.
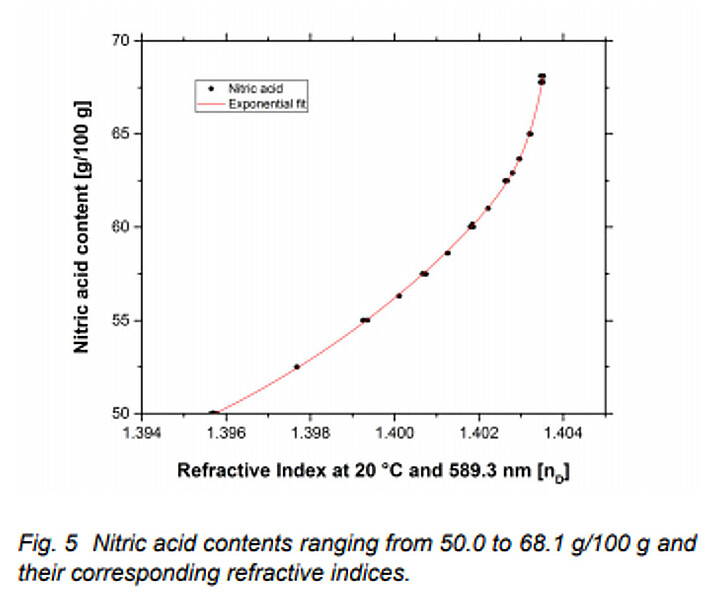
An example: Aqueous nitric acid solution shows a curve in its refractive index and concentration diagram. Non-linear fits, e.g. polynomial functions, allow for use of this correlation, and modern refractometers automatically employ it to determine concentration in binary solutions, which counts as a basic application. Different particles or solvents have different influences on the gradient and shape of the correlation curve.
Concentration determination is also possible with so-called quasi-binary mixtures. They contain two major components and some additional ingredients, which exist in very small concentrations compared to the two main components. Due to their small impact on the main refractive index, these additional ingredients can be ignored.
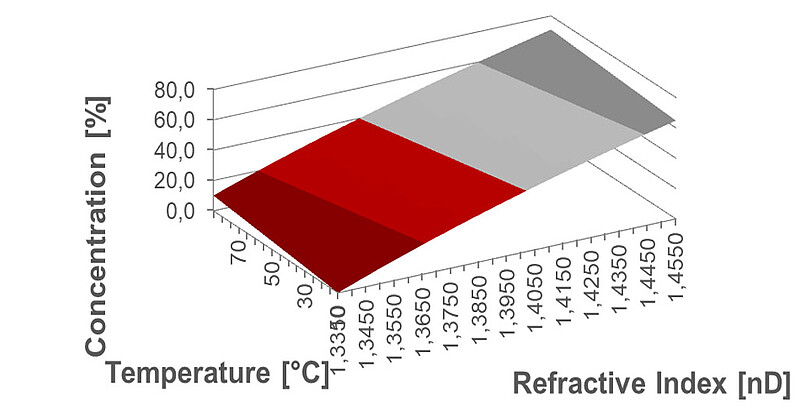
Temperature, too, significantly influences not the curves’ shape, but the refractive index values. While the number of particles / concentrations remain constant with changing temperature, the density and therefore also the particle density change. Higher temperatures will decrease the refractive index as well as the density and vice versa. Nevertheless, it is possible to integrate the temperature influence in this correlation to obtain a refractive index, temperature, and concentration plot.
Finding the right measurement principle for concentration measurement
Benefits:
- Fast measurement
- Low sample volume
- High accuracy
- No sample preparation
- Non-destructive
- Applicable for virtually all sample properties (from liquid to solid)
- No moving parts – virtually maintenance-free
Limitations:
- No powders measureable
- Only binary and quasi-binary solutions accurately determinable
Applications & industries relevant for concentration measurement
Refractometers for concentration measurement are used in various industries.
Chemical industry:
The refractive index is used in the chemical industry as the concentration parameter for basic chemicals, acids, and bases like sodium hydroxide. It is also used in the production process of polymers, e.g. PVC, to determine solvent concentration and final product quality.
Beverage industry:
In beverages and their raw materials, refractometers are used for brix measurement of syrups like HFCS, juices, smoothies and soft drinks. They are also used as caustic meters in the cleaning process (CIP) for beverage process tanks.
Food industry:
Concentration and purity control of sugar is one of the most common refractometer applications in the food industry. The determination of the iodine value for edible fats and oils is a quantitative parameter for the concentration of unsaturated fatty acids.
Pharmaceutical industry:
Salt or glucose concentration measurements for infusion solutions play an important role in the pharmaceutical industry.
Abbemat refractometers: Overview of application methods
The Abbemat refractometers are used in all industries to measure a wide range of samples, from pharmaceuticals, chemicals, petroleum products, flavors and fragrances to beverages and food. In close cooperation with customers, Anton Paar continuously collects and develops new methods and applications based on refractive index measurements. Below please find the latest list of methods being installed on the Abbemat refractometers.
s → standard
a → available
o → on request
| Method | Substance |
Standard Unit |
Measuring Range | Temperature [°C] | Accuracies | Availability | Application report | ||||
|
3001 5001 7001 |
3101 5101 |
3201 5201 7201 |
3001 3101 3201 |
5001 5101 5201 |
7001 7201 |
||||||
| Acids | |||||||||||
| Acetic Acid 0.0 - 67.0 %a) | Acetic acid content in aqueous solution | g/100 g | 0.0 - 67.0 | 20 | 0.27 | 0,1 | 0.05 | a | s | s | Link |
| Acetic Acid 67.0 - 85.0 %a) | Acetic acid content in aqueous solution | g/100 g | 67.0 - 85.0 | 20 | 0.88 | 0,56 | 0.28 | a | s | s | Link |
| Acetic Acid 86.0 - 99.8 %a) | Acetic acid content in aqueous solution | g/100 g | 86.0 - 99.8 | 20 | 1.80 | 1,32 | 0.66 | a | s | s | Link |
| Citric Acid 0.0 - 30.0 %d) | Citric acid content in aqueous solution | g/100 g | 0.0 - 30.0 | 20 | 0.1 | 0,1 | 0.05 | a | s | s | Link |
| Formic Acid 0 - 68 %d) | Formic acid content in aqueous solution | g/100 g | 0.0 - 68.0 | 20 | 0.4 | 0,32 | 0.16 | a | s | s | Link |
| Hydrochloric Acida) | Hydrochloric acid content in aqueous solution | g/100 g | 0.0 - 37.0 | 20 | 0.048 | 0,018 | 0.009 | s | s | s | Link |
| Lactic Acid 0 - 80 %d) | Lactic acid content in aqueous solution | g/100 g | 0.0 - 80.0 | 20 | 0.15 | 0,14 | 0.07 | a | s | s | |
| Nitric Acid 0 - 50 %a) | Nitric acid content in aqueous solution | g/100 g | 0.0 - 50.0 | 20 | 0.12 | 0,04 | 0.02 | a | s | s | Link |
| Nitric Acid 50 - 68.1 %a) | Nitric acid content in aqueous solution | g/100 g | 50.0 - 68.1 | 20 |
50-68.1%: 1.15 50-61%: 0.28 61-65%: 0.80 65-68.1%: 1.15 |
50-68.1%: 0.5 50-61%: 0.12 61-65%: 0.30 65-68.1%: 0.5 |
50-68.1%: 0.25 50-61%: 0.06 61-65%: 0.15 65-68.1%: 0.25 |
a | s | s | Link |
| Oxalic Acid 0 - 8 %d) | Ocalic acid content in aqueous solution | g/100 g | 0.0 - 8.0 | 20 | 0.13 | 0,108 | 0.054 | a | s | s | |
| Phosphoric Acid 0.0 - 40.0 %d) | Phosphoric acid content in aqueous solution | g/100 g | 0.0 - 40.0 | 20 | 0.16 | 0,14 | 0.07 | a | s | s | |
| Sulfuric Acid 0.0 - 84.5 %a) | Sulfuric acid content in aqueous solution | g/100 g | 0.0 - 84.5 | 20 | 0.142 | 0,056 | 0.028 | a | s | s | Link |
| Sulfuric Acid 87.0 - 98.0 %a) | Sulfuric acid content in aqueous solution | g/100 g | 87.0 - 98.0 | 20 | 0.29 | 0,12 | 0.06 | a | s | s | Link |
| Tartaric Acid 0.0 - 58.0 %d) | Tartaric acid content in aqueous solution | g/100 g | 0.0 - 56.0 | 20 | 0.08 | 0,04 | 0.02 | a | s | s | |
| Trichloracetic Acid 0.0 - 48.0 %d) | Trichloracetic acid content in aqueous solution | g/100 g | 0.0 - 48.0 | 20 | 0.18 | 0,22 | 0.11 | a | s | s | |
| Alcohols | |||||||||||
| 1-Propanold) | 1-propanol content in aqueous solution | g/100 g | 0.0 - 100.0 | 20 | 0.94 | 0,84 | 0.42 | a | s | s | |
| Ethanol 0.0 - 54.0 %d) | Ethanol content in aqueous solution | g/100 g | 0.0 - 54.0 | 20 | 0.41 | 0,16 | 0.08 | a | s | s | |
| Ethanol 54.0 - 80.0 %d) | Ethanol content in aqueous solution | g/100 g | 54.0 - 80.0 | 20 | 2.23 | 0,94 | 0.47 | a | s | s | |
| Ethanol 84.0 - 100.0 %d) | Ethanol content in aqueous solution | g/100 g | 84.0 - 100.0 | 20 | 1.12 | 0,46 | 0.23 | a | s | s | |
| Ethanol in Sanitizer (WHO recipe) | Ethanol content in hand sanitizer (WHO recipe) | ml/100 ml | 0.0 - 85.0 | 20 | 2,23 | 0,94 | 0,47 | a | s | s | |
| Glycerola) | Glycerol content in aqueous solution | g/100 g | 0.0 - 99.8 | 20 | 0.085 | 0,034 | 0.017 | a | s | s | |
| Glycerol 0.0 - 10.0 %a) | Glycerol content in aqueous solution | g/100 g | 0.0 - 10.0 | 25 | 0.09 | 0,04 | 0.02 | a | s | s | |
| Isopropyl Alcohol 0.0 - 70.0 %a) | Isopropyl alcohol content in aqueous solution | g/100 g | 0.0 - 70.0 | 20 | 0.59 | 0,84 | 0.42 | a | s | s | |
| Isopropyl Alcohol 60.0 - 80.0 %a) | Isopropyl alcohol content in aqueous solution | g/100 g | 60.0 - 80.0 | 20 | 0.72 | 0,72 | 0.36 | a | s | s | |
| Isopropyl Alcohol 80.0 - 92.0 %a) | Isopropyl alcohol content in aqueous solution | g/100 g | 80.0 - 92.0 | 20 | 2.5 | 1,6 | 0.8 | a | s | s | |
| Isopropyl Alcohol 95.0 - 99.5 %a) | Isopropyl alcohol content in aqueous solution | g/100 g | 95.0 - 99.5 | 20 | 2.0 | 1,04 | 0.52 | a | s | s | |
| Isopropyl Alcohol in Sanitizer (WHO recipe) | Isopropyl alcohol content in hand sanitizer (WHO recipe) | ml/100 ml | 65.0-83.0 | 20 | 0,72 | 0,72 | 0,36 | a | s | s | |
| Methanol 0.0 - 44.0 %d) | Methanol content in aqueous solution | g/100 g | 0.0 - 44.0 | 20 | 1.0 | 0,4 | 0.2 | a | s | s | |
| Methanol 60.0 - 100.0 %d) | Methanol content in aqueous solution | g/100 g | 60.0 - 100.0 | 20 | 0.96 | 0,38 | 0.19 | o | o | s | |
| Antifreeze | |||||||||||
| Antifreeze Ethylene Glycol (Freezing Point) | Freezing point of ethylene glycol | °C | -50.0 - 0.0 | 20 | 0.15 | 0,06 | 0,03 | s | s | s | |
| Antifreeze Ethylene Glycol [°F] (Freezing Point) | Freezing point of ethylene glycol | °F | -58.0 - 32.0 | 20 | 0,06 | 0,54 | 0,27 | s | s | s | |
| Antifreeze Ethylene Glycol [g/100 g] | Ethylene glycol content | g/100 g | 0.0 - 60.0 | 20 | 0.11 | 0,04 | 0,02 | a | s | s | |
| Antifreeze Ethylene Glycol [mL/100 mL] | Percentage by volume of ethylene glycol | mL/100 mL | 0.0 - 57.81 | 20 | 0.11 | 0,04 | 0,02 | a | s | s | |
| Antifreeze Propylene Glycol (Freezing Point) | Freezing point of propylene glycol | °C | -51.0 - 0.0 | 20 | 0.22 | 0,08 | 0,04 | a | s | s | |
| Antifreeze Propylene Glycol [g/100 g] | Propylene glycol content | g/100 g | 0.0 - 60.0 | 20 | 0.10 | 0,04 | 0,02 | a | s | s | |
| Antifreeze Propylene Glycol [mL/100 mL] | Percentage by volume of propylene glycol | mL/100 mL | 0.0 - 50.0 | 20 | 0.12 | 0,048 | 0,024 | a | s | s | |
| Fuel System Icing Inhibitors (ASTM D5006) | Percentage by volume of fuel system icing inhibitors is calculated according to ASTM D5006, diethylene glycol monomethyl ether (DiEGME) in aviation fuels | g/100 mL | 0.01 - 0.25 | 20 | 0.0014 | 0,0006 | 0,0003 | a | s | s | |
| Bases | |||||||||||
| Ammonium Hydroxided) | Ammonium hydroxide content in aqueous solution | g/100 g | 0.0 - 30.0 | 20 | 0.23 | 0,12 | 0.06 | a | s | s | |
| Potassium Hydroxidea) | Potassium hydroxide content in aqueous solution | g/100 g | 0.0 - 50.0 | 20 | 0.057 | 0,022 | 0.011 | o | s | s | |
| Sodium Hydroxide 0.0 - 50.0 %d) | Sodium hydroxide content in aqueous solution | g/100 g |
0.0 - 25.0 25.0 - 50.0 |
20 |
0-25%: 0.047 25-50%: 0.091 |
0-25%: 0.018 25-50%: 0.036 |
0-25%: 0.009 25-50%: 0.018 |
s | s | s | |
| Beverage | |||||||||||
| Brix (ICUMSA 2000)b) | Dry substance content in confectionaries, plant juices, syrups, marmalades, jams and sucrose content of high purity sucrose solutions | g/100 g | 0.0 - 100.0 | TC* | 0.05 | 0,03 | 0.015 | s | s | s | |
| Brix (%)b) | Dry substance content in confectionaries, plant juices, syrups, marmalades, jams and sucrose content of high purity sucrose solutions | g/100 g | 0.0 - 100.0 | TC* | 0.05 | 0.03 | 0.015 | a | s | s | |
| Brix (°Brix)b) | Dry substance content in confectionaries, plant juices, syrups, marmalades, jams and sucrose content of high purity sucrose solutions | g/100 g | 0.0 - 100.0 | TC* | 0.05 | 0.03 | 0.015 | a | s | s | |
| Corn Syrup, AC, 28 DE | Dry matter composed of 28 dextrose equivalents (DE) in acid converted (AC) corn syrup | g/100 g | 0.0 - 90.0 | 20 | 0.03 | 0.02 | 0.01 | a | s | s | |
| Corn Syrup, AC, 28 DE, 0.4 % Ash, TC* | Dry matter in acid converted (AC) corn syrup containing 28 dextrose equivalents (DE) and 0.4 % Ash (dry basis), temp. controlled (TC*) from 20 °C to 60 °C | g/100 g | 0.0 - 70.0 | TC* | 0.24 | 0.2 | 0.10 | o | s | s | |
| Corn Syrup, AC, 42 DE, 0.4 % Ash, TC* | Dry matter in acid converted (AC) corn syrup containing 42 dextrose equivalents (DE) and 0.4 % Ash (dry basis), temp. controlled (TC*) from 20 °C to 60 °C | g/100 g | 0.0 - 84.0 | TC* | 0.23 | 0.28 | 0.14 | o | s | s | |
| Corn Syrup, AC, 55 DE, 0.4 % Ash, TC* | Dry matter in acid converted (AC) corn syrup containing 55 dextrose equivalents (DE) and 0.4 % Ash (dry basis), temp. controlled (TC*) from 20 °C to 60 °C | g/100 g | 0.0 - 84.0 | TC* | 0.24 | 0.28 | 0.14 | o | s | s | |
| Corn Syrup, DC, 32 DE, 0.4 % Ash, TC* | Dry matter in acid converted (AC) corn syrup containing 32 dextrose equivalents (DE) and 0.4 % Ash (dry basis), temp. controlled (TC*) from 20 °C to 60 °C | g/100 g | 0.0 - 84.0 | TC* | 0.22 | 0.3 | 0.15 | o | s | s | |
| Corn Syrup, DC, 63 DE, 0.4 % Ash, TC* | Dry matter in acid converted (AC) corn syrup containing 63 dextrose equivalents (DE) and 0.4 % Ash (dry basis), temp. controlled (TC*) from 20 °C to 60 °C | g/100 g | 0.0 - 84.0 | TC* | 0.24 | 0.28 | 0.14 | o | s | s | |
| Corn Syrup, DC, 70 DE, 0.4 % Ash, TC* | Dry matter in acid converted (AC) corn syrup containing 70 dextrose equivalents (DE) and 0.4 % Ash (dry basis), temp. controlled (TC*) from 20 °C to 60 °C | g/100 g | 0.0 - 84.0 | TC* | 0.25 | 0.28 | 0.14 | o | s | s | |
| Corn Syrup, DC, 95 DE, 0.4 % Ash, TC* | Dry matter in acid converted (AC) corn syrup containing 95 dextrose equivalents (DE) and 0.4 % Ash (dry basis), temp. controlled (TC*) from 20 °C to 60 °C | g/100 g | 0.0 - 74.0 | TC* | 0.26 | 0.2 | 0.10 | o | s | s |
|
| HFCS, 42 % Fructose, 0.05 % Ash, TC* | Dry matter in high fructose corn syrup (HFCS) containing 42 % fructose, with 0.05 % Ash (dry basis), temp. controlled (TC*) from 20 °C to 60 °C | g/100 g | 0.0 - 84.0 | TC* | 0.83 | 0.88 | 0.44 | o | s | s | |
| HFCS, 55 % Fructose, 0.05 % Ash, TC* | Dry matter in high fructose corn syrup (HFCS) containing 55 % fructose, with 0.05 % Ash (dry basis), temp. controlled (TC*) from 20 °C to 60 °C | g/100 g | 0.0 - 84.0 | TC* | 0.41 | 0.34 | 0.17 | o | s | s | |
| HFCS, 90 % Fructose, 0.05 % Ash, TC* | Dry matter in high fructose corn syrup (HFCS) containing 90 % fructose, with 0.05 % Ash (dry basis), temp. controlled (TC*) from 20 °C to 60 °C | g/100 g | 0.0 - 84.0 | TC* | 0.15 | 0.28 | 0.14 | o | s | s | |
| HMCS, DC, 42 DE, 0.4 % Ash, TC* | Dry matter in dual converted (DC) high maltose corn syrup (HMCS) containing 42 dextrose equivalents (DE) and 0.4 % Ash (dry basis), temp. controlled (TC*) from 20 °C to 60 °C | g/100 g | 0.0 - 84.0 | TC* | 0.23 | 0.28 | 0.14 | o | s | s | |
| HMCS, DC, 50 DE, 0.4 % Ash, TC* | Dry matter in dual converted (DC) high maltose corn syrup (HMCS) containing 50 dextrose equivalents (DE) and 0.4 % Ash (dry basis), temp. controlled (TC*) from 20 °C to 60 °C | g/100 g | 0.0 - 84.0 | TC* | 0.23 | 0.28 | 0.14 | o | s | s | |
| Must Weight (°Babo)e) | Must weight in grape must (°Babo scale) | °Babo | 0.3 - 37.8 | 20 | 0.06 | 0,024 | 0.012 | a | s | s | |
| Must Weight (°Baumé)e) | Must weight in grape must (°Baumé scale) | °Baumé | 0.56 - 39.54 | 20 | 0.089 | 0,046 | 0.023 | a | s | s | |
| Must Weight (°KMW, °KI)e) | Must weight in grape must (Austria) | °KMW | 0.340 - 37.716 | 20 | 0.06 | 0,024 | 0.012 | a | s | s | |
| Must Weight (°Oe, CH)e) | Must weight in grape must (Switzerland) | °Oe | 1.413 - 201.479 | 20 | 0.108 | 0,108 | 0.054 | a | s | s | |
| Must Weight (°Oe, GER)e) | Must weight in grape must (Germany) | °Oe | 0.92 - 201.68 | 20 | 0.268 | 0,106 | 0.053 | a | s | s | |
| Must Weight (°Plato) | Must weight in beer or wine | °Plato | 0.0 - 88.4 | 20 | 0.073 | 0,03 | 0.015 | a | s | s | |
| Zeiss (14.45) | Quick estimate of alcohol by %vol in wine, cider and beer in combination with a hydrometer | Z | 14.4 -140.00 | 20 | 0.87 | 0,34 | 0.17 | a | s | s | |
| Zeiss (15.00) | Quick estimate of alcohol by %vol in wine, cider and beer in combination with a hydrometer | Z | 15.00-140.00 | 20 | 0.87 | 0.34 | 0.17 | a | s | s | |
| Food | |||||||||||
| Butter Iodine Number | Iodine number of butter | g/100 g | 10.98 - 70.40 | 40 | 0.57 | 0,22 | 0.11 | a | s | s | |
| Butyro Fat (AOAC 921.08, TC) | Butyro value in compliance with international standards and the ancient butter refractometer | - | 0.0 - 79.5 | TC* | 0.18 | 0,07 | 0.035 | o | s | s | |
| Butyro Oil (AOAC 921.08, TC) | Butyro value in compliance with international standards and the ancient butter refractometer | - | 0.0 - 79.5 | TC* | 0.18 | 0,07 | 0.035 | o | s | s | |
| Butyro Fat (FSSAI, TC) | Butyro value extended range from Food Safetay Standards India (FSSAI) | - | 0.0 - 100.0 | TC* | 0.03 | 0,32 | 0.16 | o | s | s | |
| Butyro Oil (FSSAI, TC) | Butyro value extended range from Food Safetay Standards India (FSSAI) | - | 0.0 - 100.0 | TC* | 0.03 | 0,32 | 0.16 | o | s | s | |
| Cacao Fat (AOAC 921.78, TC) | The cacao fat value in compliance with international standards and the ancient butter refractometer | - | 0.0 - 79.5 | TC* | 0.18 | 0,07 | 0.035 | o | s | s | |
| Castor Oil (ASTM) Iodine Number | Iodine number (g I2/100 g oil) of castor oil in compliance with ASTM D960-52 (1952) | IN | 82.0 - 88.0 | 30 | 0.2 | 0,08 | 0.04 | o | s | s | |
| Castor Oil Iodine Number | Iodine number (g I2/100 g oil) of castor oil | IN | 4.7 - 84.6 | 60 | 0.68 | 0,28 | 0.14 | o | s | s | |
| Coconut Oil Iodine Number | Iodine number (g I2/100 g oil) of edible coconut oil | IN | 6.3 - 10.6 | 40 | 0.22 | 0,08 | 0.04 | o | s | s | |
| Cottonseed Oil (Indian) Iodine Number | Iodine number (g I2/100 g oil) of Indian cottonseed oil | IN | 0.0 - 100.0 | 60 | 1.0 | 0,4 | 0.2 | a | s | s | |
| Cottonseed Oil Iodine Number | Iodine number (g I2/100 g oil) of cottonseed oil | IN | 100.0 - 123.0 | 40 | 0.29 | 0,12 | 0.06 | o | s | s | |
| Flaxseed Oil Iodine Number | Iodine number (g I2/100 g oil) of crude flaxseed oil | IN | 134.4 - 206.5 | 20 - 30 | 0.86 | 0,34 | 0.17 | o | s | s | |
| Honey Moisture Content | Water content in honey | g/100 g | 0.0 - 46.0 | 20 | 0.04 | 0,016 | 0.008 | a | s | s | |
| Iodine Numbers acc. to JASf) | Iondine Number (gI2/100 g) of safflower oil (also high oleic), grape oil, soybean oil, sunflower oil (also high oleic), corn oil, cottonseed oil, sesame oil, rice oil, olive oil, palm oil, and coconut oil | IN | 7.0 - 148.0 | 25 | 0.8 | 0,32 | 0.16 | s | s | s | |
| Linseed Oil Iodine Number | Iodine number (g I2/100 g oil) of linseed oil | IN | 3.0 - 173.0 | 60 | 0.89 | 0,36 | 0.18 | o | s | s | |
| Moisture Content | Water content in sugar solutions | g/100 g | 0.0 - 100.0 | 20 | 0.05 | 0,03 | 0.015 | o | s | s | |
| Olive Oil (Pomace) Iodine Number at 40 °C | Iodine number (g I2/100 g oil) of olive oil (Pomace) at 40 °C | IN | 75.0 - 92.0 | 40 | 0.61 | 0,24 | 0.12 | o | s | s | |
| Olive Oil (Pomace) Iodine Number at 20 °C | Iodine number (g I2/100 g oil) of olive oil (Pomace) at 20 °C | IN | 75.0 - 92.0 | 20 | 0.63 | 0,26 | 0.13 | o | s | s | |
| Olive Oil (Refined) Iodine Number at 40 °C | Iodine number (g I2/100 g oil) of olive oil (Refined) at 40 °C | IN | 75.0 - 94.0 | 40 | 0.61 | 0,26 | 0.13 | o | s | s | |
| Olive Oil (Refined) Iodine Number at 20 °C | Iodine number (g I2/100 g oil) of olive oil (Refined) at 20 °C | IN | 75.0 - 94.0 | 20 | 0.68 | 0,28 | 0.14 | o | s | s | |
| Olive Oil (Virgin) Iodine Number at 40 °C | Iodine number (g I2/100 g oil) of olive oil (Virgin) at 40 °C | IN | 75.0 - 94.0 | 40 | 0.61 | 0,26 | 0.13 | o | s | s | |
| Olive Oil (Virgin) Iodine Number at 20 °C | Iodine number (g I2/100 g oil) of olive oil (Virgin) at 20 °C | IN | 75.0 - 94.0 | 20 | 0.68 | 0,28 | 0.14 | o | s | s | |
| Palm Kernel Oil Iodine Number | Iodine number (g I2/100 g oil) of palm kernel oil at 40 °C | IN | 14.1 - 21.0 | 40 | 0.17 | 0,08 | 0.04 | a | s | s | |
| Palm Oil Iodine Number | Iodine number (g I2/100 g oil) of palm oil | IN | 44 - 58 | 40 | 0.47 | 0,18 | 0.09 | a | s | s | |
| Palm Olein Iodine Number | Iodine number (g I2/100 g oil) of palm olein | IN | 54 - 62 | 40 | 0.13 | 0,054 | 0.027 | a | s | s | |
| Scale of the Milk Fat Refractometer | Refractive index of milk samples converted into the scale of the milk fat refractometer | - | 0.0 - 100.0 | 20 | 0.14 | 0,06 | 0.03 | a | s | s | |
| Soybean Oil Iodine Number | Iodine number(g I2/100 g oil) of soybean oil | IN | 100 - 150 | TC* | 0.87 | 0,34 | 0.17 | o | s | s | |
| Sunflower Oil (high oleic) Iodine Number | Iodine number (g I2/100 g oil) of crude, sunflower seed oil with high oleic acid content | IN | 78.0 - 90.0 | 25 | 0.3 | 0,12 | 0.06 | o | s | s | |
| Sunflower Oil (mid oleic) Iodine Number | Iodine number (g I2/100 g oil) of crude, sunflower seed oil with mid oleic acid content | IN | 94.0 - 122.0 | 25 | 0.28 | 0,12 | 0.06 | o | s | s | |
| Sunflower Oil (tradit.) Iodine Number | Iodine number (g I2/100 g oil) of crude, traditional sunflower seed oil | IN | 100.0 - 140.0 | 40 | 0.25 | 0,1 | 0.05 | o | s | s | |
| Inorganic Chemicals | |||||||||||
| Ammonium Chloride 0 - 24 %d) | Ammonium chloride content in aqueous solution | g/100 g | 0.0 - 24.0 | 20 | 0.076 | 0,06 | 0.03 | a | s | s | |
| Ammonium Sulfate 0 - 40 %d) | Ammonium sulfate content in aqueous solution | g/100 g | 0.0 - 40.0 | 20 | 0.11 | 0,12 | 0.06 | a | s | s | |
| Barium Chloride 0 - 26 %d) | Barium chloride content in aqueous solution | g/100 g | 0.0 - 26.0 | 20 | 0.09 | 0,08 | 0.04 | a | s | s | |
| Caesium Chloride 0 - 64 %d) | Caesium chloride content in aqueous solution | g/100 g | 0.0 - 64.0 | 20 | 0.19 | 0,16 | 0.08 | a | s | s | |
| Calcium Chloride 0 - 40 %d) | Calcium chloride content in aqueous solution | g/100 g | 0.0 - 40.0 | 20 | 0.06 | 0,06 | 0.03 | a | s | s | |
| Copper Sulfate 0.0 - 18.0 %d) | Copper sulfate content in aqueous solution | g/100 g | 0.0 - 18.0 | 20 | 0.07 | 0,06 | 0.03 | a | s | s | |
| Ferric Chloride 0 - 14 %d) | Ferric chloride content in aqueous solution | g/100 g | 0.0 - 14.0 | 20 | 0.05 | 0,04 | 0.02 | a | s | s | |
| Hydrogen Peroxide | Hydrogen perocide content in aqueous solution | g/100 g | 0.0 - 100.0 | 25 | 0.33 | 0,44 | 0.22 | s | s | s | |
| Lithium Chloride 0 - 30 %d) | Lithium chloride content in aqueous solution | g/100 g | 0.0 - 30.0 | 20 | 0.07 | 0,06 | 0.03 | a | s | s | |
| Magnesium Chloride 0 - 30 %d) | Magnesium chloride content in aqueous solution | g/100 g | 0.0 - 30.0 | 20 | 0.06 | 0,06 | 0.03 | a | s | s | |
| Magnesium Sulfate 0 - 26 %d) | Magnesium sulfate content in aqueous solution | g/100 g | 0.0 - 26.0 | 20 | 0,07 | 0,06 | 0,03 | a | s | s | |
| Manganese(II) Sulfate 0.0 - 20.0 %d) | Manganese(II) sulfate content in aqueous solution | g/100 g | 0.0 - 20.0 | 20 | 0.08 | 0,06 | 0.03 | a | s | s | |
| Potassium Bicarbonate 0 - 24 %d) | Potassium bicarbonate content in aqueous solution | g/100 g | 0.0 - 24.0 | 20 | 0.15 | 0,16 | 0.08 | a | s | s | |
| Potassium Bromide 0 - 40 %d) | Potassium bromide content in aqueous solution | g/100 g | 0.0 - 40.0 | 20 | 0.12 | 0,1 | 0.05 | a | s | s | |
| Potassium Carbonate 0 - 50 % d) | Potassium carbonate content in aqueous solution | g/100 g | 0.0 - 50.0 | 20 | 0.08 | 0,06 | 0.03 | a | s | s | |
| Potassium Chloride 0 - 24 %d) | Potassium chloride content in aqueous solution | g/100 g | 0.0 - 24.0 | 20 | 0.11 | 0,1 | 0.05 | a | s | s | |
| Potassium Dihydrogen Phosphate 0 - 10 %d) | Potassium dihydrogen phosphate content in aqueous solution | g/100 g | 0.0 - 10.0 | 20 | 0.12 | 0,1 | 0.05 | a | s | s | |
| Potassium Hydrogen Phosphate 0 - 8 %d) | Potassium hydrogen phosphate content in aqueous solution | g/100 g | 0.0 - 8.0 | 20 | 0.95 | 0,86 | 0.43 | a | s | s | |
| Potassium Iodide 0 - 40 %d) | Potassium iodide content in aqueous solution | g/100 g | 0.0 - 40.0 | 20 | 0.11 | 0,096 | 0.048 | a | s | s | |
| Potassium Nitrate 0 - 24 %d) | Potassium nitrate content in aqueous solution | g/100 g | 0.0 - 24.0 | 20 | 0.15 | 0,14 | 0.07 | a | s | s | |
| Potassium Sulfate 0 - 10 %d) | Potassium sulfate content in aqueous solution | g/100 g | 0.0 - 10.0 | 20 | 0.12 | 0,092 | 0.046 | a | s | s | |
| Salinity, NaCl | Sodium chloride content in aqueous solution | g/100 g | 0.0 - 30.0 | 20 | 0.058 | 0,024 | 0.012 | s | s | s | |
| Silver Nitrate 0 - 40 %d) | Silver nitrate content in aqueous solution | g/100 g | 0.0 - 40.0 | 20 | 0.19 | 0,24 | 0.12 | a | s | s | |
| Sodium Bicarbonate 0.0 - 6.0 %d) | Sodium bicarbonate content in aqueous solution | g/100 g | 0.0 - 6.0 | 20 | 0.10 | 0,08 | 0.04 | a | s | s | |
| Sodium Bromide 0 - 40 %d) | Sodium bromide content in aqueous solution | g/100 g | 0.0 - 40.0 | 20 | 0.10 | 0,08 | 0.04 | a | s | s | |
| Sodium Carbonate 0.0 - 15.0 %d) | Sodium carbonate content in aqueous solution | g/100 g | 0.0 - 15.0 | 20 | 0.05 | 0,06 | 0.03 | a | s | s | |
| Sodium Chloride 0.0 - 26.0 %d) | Sodium chloride content in aqueous solution | g/100 g | 0.0 - 30.0 | 20 | 0.08 | 0,08 | 0.04 | a | s | s | |
| Sodium Dihydrogen Phosphate 0.0 - 40.0 %d) | Sodium dihydrogen phosphate content in aqueous solution | g/100 g | 0.0 - 40.0 | 20 | 0.11 | 0,1 | 0.05 | a | s | s | |
| Sodium Hydrogen Phosphate 0.0 - 5.5 %d) | Sodium hydrogen phosphate content in aqueous solution | g/100 g | 0.0 - 5.5 | 20 | 0.07 | 0,06 | 0.03 | a | s | s | |
| Sodium Nitrate 0.0 - 40.0 %d) | Sodium nitrate content in aqueous solution | g/100 g | 0.0 - 40.0 | 20 | 0.10 | 0,1 | 0.05 | a | s | s | |
| Sodium Phosphate 0.0 - 8.0 %d) | Sodium phosphate content in aqueous solution | g/100 g | 0.0 - 8.0 | 20 | 0.06 | 0,04 | 0.02 | a | s | s | |
| Sodium Sulfate 0.0 - 22.0 %d) | Sodium sulfate content in aqueous solution | g/100 g | 0.0 - 22.0 | 20 | 0.14 | 0,14 | 0.07 | a | s | s | |
| Sodium Thiosulfate 0.0 - 40.0 %d) | Sodium thiosulfate content in aqueous solution | g/100 g | 0.0 - 40.0 | 20 | 0.07 | 0,06 | 0.03 | a | s | s | |
| Strontium Chloride 0 - 36 %d) | Strontium chloride content in aqueous solution | g/100 g | 0.0 - 36.0 | 20 | 0.08 | 0,06 | 0.03 | a | s | s | |
| Zinc Sulfate 0.0 - 16.0 %d) | Zinc sulfate content in aqueous solution | g/100 g | 0.0 - 16.0 | 20 | 0.08 | 0,08 | 0.04 | a | s | s | |
| Medical/Pharma | |||||||||||
| Clonidine HCl (10 mg/mL) and NaCl (9 mg/mL) | Percentage of 10 mg/mL clonidine HCl and 9 mg/mL sodium chloride (≙ 100 %) in an aqueous solution | % | 95.0 - 105.0 | 20 | 6.5 | 3,2 | 1.6 | o | s | s | |
| EDTA Sodium 0.0 - 6.0 %d) | EDTA content in aqueous solution | g/100 g | 0.0 - 6.0 % | 20 | 0.08 | 0,08 | 0.04 | a | s | s | |
| Human Serum/Plasma Specific Gravityc) | Specific gravity of human blood serum / plasma | - | 1.0000 - 1.0420 | 20 | 0.0004 | 0,0002 | 0.0001 | a | s | s | |
| Human Serum/Plasma Total Protein Concentrationc) | Total protein concentration in human blood serum /plasma | g/100 mL | 0.0 - 14.1 | 20 | 0.07 | 0,04 | 0.02 | a | s | s | |
|
Human Serum Plasma Total Solids [g/100 mL]c) |
Concentration of total dissolved solids in human blood serum / plasma | g/100 mL | 0.0 - 15.6 | 20 | 0.07 | 0,02 | 0.01 | a | s | s | |
| Human Serum/Plasma Total Solidsc) | Content of total dissolved solids in human blood serum /plasma | g/100 g | 0.0 - 15.0 | 20 | 0.07 | 0,02 | 0.01 | a | s | s | |
| Human Serum/Plasma Water Concentrationc) | Water concentration in human blood serum/plasma | g/100 mL | 99.8 - 88.4 | 20 | 0.05 | 0,02 | 0.01 | a | s | s | |
| Human Urine Specific Gravityc) | Specific gravity of human urine | - | 1.000 - 1.039 | 20 | 0.0004 | 0,0004 | 0.0002 | a | s | s | |
| Human Urine Total Solids [g/100 mL]c) | Total solids concentration of human urine | g/100 mL | 0.0 - 10.3 | 20 | 0.08 | 0,06 | 0.03 | a | s | s | |
| Human Urine Total Solidsc) | Total solids content of human urine | g/100 g | 0.0 - 9.9 | 20 | 0.07 | 0,02 | 0.01 | a | s | s | |
| Human Urine Water Concentrationc) | Water concentration of human urine | g/L | 935.0 - 996.0 | 20 | 0.8 | 0,8 | 0.4 | a | s | s | |
| Magnesium Chloride (101.6 mg/mL) | Percentage of magnesium chloride (101.6 mg/mL ≙ 100 %) in an aqueous solution | % | 95.0 - 105.0 | 20 | 0.88 | 0,36 | 0.18 | o | s | s | |
| Sodium Benzoate (100 mg/mL) | Percentage of sodium benzoate (100.0 mg/mL ≙ 100 %) in an aqueous solution | % | 95.0 - 105.0 | 20 | 0.48 | 0,22 | 0.11 | o | s | s | |
| Sodium Chloride (292.2 mg/mL) | Percentage of sodium chloride (292.2 mg/mL ≙ 100 %) in an aqueous solution | % | 95.0 - 105.0 | 20 | 0.29 | 0,14 | 0.07 | o | s | s | |
| Tolazoline HCl (10 mg/mL) and NaCl (5.6 mg/mL) | Percentage of 10 mg/mL Tolazoline HCl and 5.6 mg/mL NaCl (≙ 100 %) in an aqueous solution | % | 95.0 - 105.0 | 20 | 4.7 | 2,0 | 1.0 | a | s | s | |
| Tris(hydroxymethyl) Methylamine 0.0 - 40.0 %d) | Tris(hydroxymethyl) methylamine content in aqueous solution | g/100 g | 0.0 - 40.0 | 20 | 0.1 | 0,08 | 0.04 | a | s | s | |
| Organic Chemicals | |||||||||||
| Acetone 0.0 - 10.0 %d) | Acetone content in aqueous solution | g/100 g | 0.0 - 10.0 | 20 | 0.20 | 0,18 | 0.09 | a | s | s | |
| Dimethyformamide (DMF) 0.0 - 100.0 % | DMF content in aqueous solution | g/100 g | 0.0 - 100.0 | 20 | 0.29 | 0,118 | 0.059 | a | s | s | |
| Dimethyformamide (DMF) 0.0 - 70.0 % | DMF content in aqueous solution | g/100 g | 0.0 - 70.0 | 20 | 0.12 | 0,046 | 0.023 | a | s | s | |
| Dimethyformamide (DMF) 70.0 - 100.0 % | DMF content in aqueous solution | g/100 g | 70.0 -100.0 | 20 | 0.32 | 0,12 | 0.06 | a | s | s | |
| Sodium Acetate 0.0 - 30.0 %d) | Sodium acetate content in aqueous solution | g/100 g | 0.0 - 30.0 | 20 | 0.10 | 0,08 | 0.04 | a | s | s | |
| Sodium Citrate 0.0 - 36.0 %d) | Sodium citrate content in aqueous solution | g/100 g | 0.0 - 36.0 | 20 | 0.11 | 0,12 | 0.06 | a | s | s | |
| Urea 0.0 - 60 % | Urea content in aqeuous solution | g/100 g | 0.0 - 60.0 | 20 | 0.17 | 0,22 | 0.11 | s | s | s | |
| Urea 0.0 - 60 %, TC | Urea content in aqeuous solution | g/100 g | 0.0 - 60.0 | TC* | 2.8 | 1,12 | 0.56 | - | s | s | |
| Others | |||||||||||
| Deuterium Oxidea) | Deuterium Oxide concentration in aquesous solution | g/100 g | 0.0-99.9 | 20 | 2.35 | 0,94 | 0.47 | a | s | s | |
| Refractive Index | Liquids and solids | nD | 1.26 - 1.72 | TC* | 0.0001 | 0.00004 | 0.00002 | s | s | s | |
| Sugar | |||||||||||
| Brix (ICUMSA 2000)b) | Dry substance content in confectionaries, plant juices, syrups, marmalades, jams and sucrose content of high purity sucrose solutions | g/100 g | 0.0 - 100.0 | TC* | 0.05 | 0,03 | 0.015 | s | s | s | |
| Brix (%)b) | Dry substance content in confectionaries, plant juices, syrups, marmalades, jams and sucrose content of high purity sucrose solutions | g/100 g | 0.0 - 100.0 | TC* | 0.05 | 0,03 | 0.015 | a | s | s | |
| Brix (°Brix)b) | Dry substance content in confectionaries, plant juices, syrups, marmalades, jams and sucrose content of high purity sucrose solutions | g/100 g | 0.0 - 100.0 | TC* | 0.05 | 0,03 | 0.015 | a | s | s | |
| Fructose (ICUMSA 2000)b) | Fructose content of high purity fructose solutions | g/100 g | 0.0 - 100.0 | TC* | 0.05 | 0,03 | 0.015 | o | s | s | |
| Glucose (ICUMSA 2000)b) | Glucose content of high purity glucose solutions | g/100 g | 0.0 - 100.0 | TC* | 0.05 | 0,03 | 0.015 | o | s | s | |
| Invert Sugar (ICUMSA 2000)b) | Content of high purity invert sugar solutions | g/100 g | 0.0 - 100.0 | TC* | 0.05 | 0,03 | 0.015 | o | s | s | |
| Lactose 0 - 17 %d) | Lactose content in aqueous solution | g/100 g | 0.0 - 17.0 | 20 | 0.069 | 0,028 | 0.014 | a | s | s | |
| Maltose 0 - 60 %d) | Maltose content in aqueous solution | g/100 g | 0.0 - 60.0 | 20 | 0.07 | 0,02 | 0.01 | a | s | s | |
| Sucrose/Saccharose (ICUMSA 2000)b) | Sucrose/saccharose content of high purity sucrose/saccharose solutions | g/100 g | 0.0 - 100.0 | TC* | 0.05 | 0,03 | 0.015 | o | s | s | |
*TC = temperature corrected (not applicable for Abbemat 3X01)
a) Anton Paar method
b) ICUMSA methods
c) Original data published by Wolf in 1966 "Aqueous Solutions And Body Fluids"
d) Original data published in CRC Handbook of Chemistry and Physics
e) Original data published by Tanner/Brunner in 1979 "Getränke Analytik"
f) JAS = Japanese Agriculture Standard
Alternative methods
Titration
Titration (also known as volumetry, titrimetry, or volumetric analysis) is a quantitative analytic method using a standard solution which reacts with the sample and shows a transition point at a defined ratio. Direct titration is the best-known form of titration which is used to determine, e.g., the amount of acids or bases.
Finding the right measurement principle for concentration measurement
Benefits:
- High accuracy
- Selective concentration determination in multi-component mixtures
Limitations:
- Sample preparation necessary
- Accuracy depends on mass solution
- Destructive measurement
- Chemical waste
- Slow measurement cycle
Chromatography
Chromatography, e.g. HPLC (high-pressure liquid chromatography) and GC (gas chromatography), is a quantitatively and qualitatively analytical method for separation and concentration measurement of substances. The principle is based on molecular interaction between the dissolved analyte (mobile phase) and the environment (stationary phase). A stronger interaction with the stationary phase leads to a longer retention period and results in a separation of substances.
Finding the right measurement principle for concentration measurement
Benefits:
- High accuracy
- Selective concentration determination in multi-component mixtures
Limitations:
- Sample preparation necessary
- Complex setup and experienced users necessary
- Chemical waste
- Slow measurement cycle