Temperature Validation for Non-Ambient XRD
Temperature validation for non-ambient X-ray diffraction (NA-XRD) determines the relation between the temperature of the temperature sensor in the heating attachment and the true temperature on the surface of the sample. Besides others, two main methods for temperature validation are used in NA-XRD:
- Validation by the use of phase transition
- Validation by the use of thermal lattice expansion
Validation by Phase Transition
This method makes use of substances with known temperatures of crystallographic (solid-solid) phase transition or melting points, and compares the tabulated values from the literature with the measured values.
Requirements for reference materials
Reference materials for temperature validation by phase transition have to fulfill certain requirements to be suitable for this method. They should have a well-established and reliable phase transition temperature, and the transition should occur fast for precise results. Materials with reversible phase transition are preferable, since this allows multiple validation experiments on the same sample. Lastly, the material must be stable and must not react with the attachment or the sample holder materials.
Procedure
The stepwise procedure for validation by phase transformation is given below:
- Find the best region (region of interest: ROI) of the diffractogram to monitor the phase transformation:
Usually phase transformations can be seen by observing a single or only a few reflections closely. Therefore, it is not necessary to measure a full scan over a wide angular range at each validation step. An initial full scan can be used to identify this region. - Define a short 2θ scan over the ROI
Validation by phase transformation does not require high data quality, so fast scans can be performed over the ROI established in step 1. - Heat the sample in steps and run a scan for each temperature
The temperature step size defines the thermal resolution of your validation. 1 °C steps provide precise temperature validation, but are much more time-consuming than, e.g., 5 °C steps. It makes sense to perform an initial scan with very large temperature steps (e.g., 10 °C to 20 °C) to determine the approximate temperature region of the transformation, followed by more precise measurements with smaller steps in the determined temperature region. - Plot the peak intensity vs. the displayed temperature and determine the transformation temperature
- Compare it with the value from literature
Expected values for phase transitions can be found online, in chemical handbooks or in special literature like Anton Paar’s Non-Ambient Guide[1]. A few examples are given below:
| Material | Transition Temperature / °C | solid-solid / melting point | Literature |
| KNO₃ | 128.7 | s.s. | [2] |
| KCIO₄ | 299.4 | s.s. | [2] |
| Ag₂SO₄ | 430 | s.s. | [2] |
| SiO₂ | 573 | s.s. | [3] |
| K₂SO₄ | 583 | s.s. | [3] |
| NaCl | 804 | m.p. | [4] |
| Cu | 1083 | m.p. | [4] |
Example
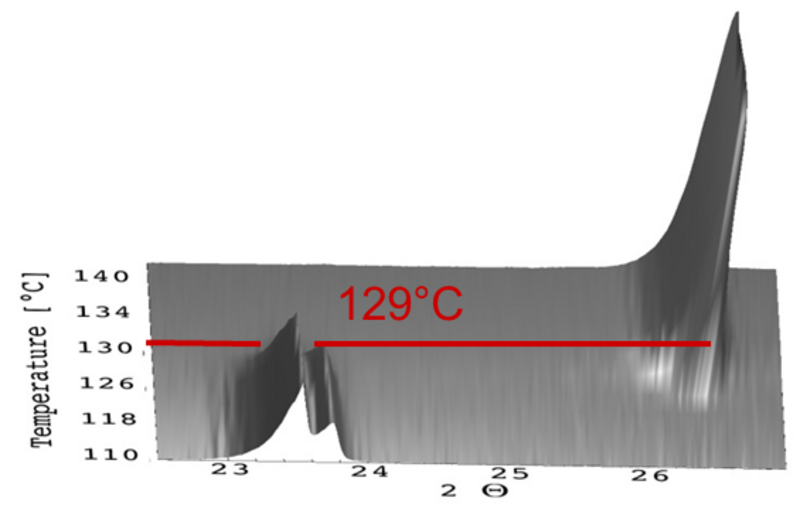
In the graph below (Figure 1) the results for KNO3, measured in a heating attachment for XRD, are shown.
The measured phase transition temperature from the orthorhombic to the trigonal structure of KNO3 was 129 °C. According to the literature, the phase transition temperature for this phase transition is 130 °C. This means that the deviation between displayed and real temperature is only 1 °C.
Validation over a wider temperature range
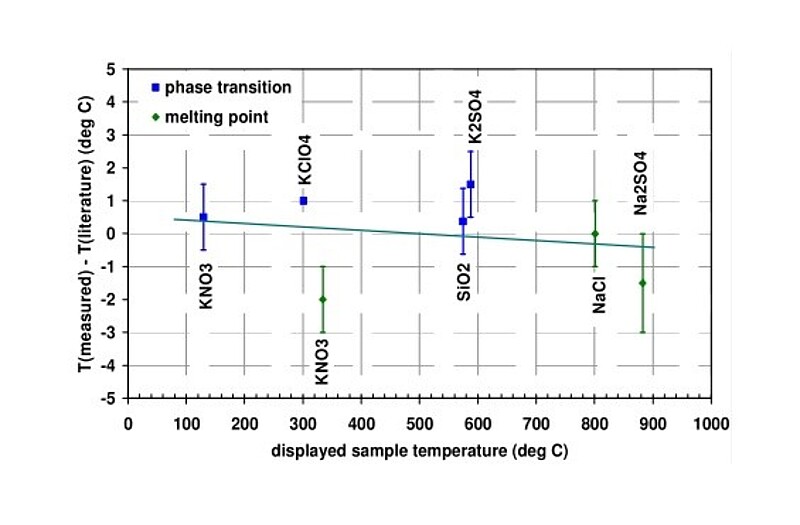
One disadvantage of the validation by using phase transitions is that a single substance has only a limited number of phase transitions. In order to have a more complete picture of the thermal behavior of the heating attachment, several substances have to be measured. (Depending on the temperature range, this can be quite time consuming.)
An example of such an extensive validation is shown in Figure 2.
Advantages and limitations
- Monitoring of phase transitions and melting points is not sensitive to sample position or data quality and requires only very simple data evaluation.
- The method is most feasible for validation over a small temperature range. To obtain a validation curve for the complete temperature range, measurement of thermal expansion is preferable.
Validation by Thermal Lattice Expansion
This method can be applied if a material with accurately known thermal expansion behavior is available. The thermal expansion curve of a certain material relates the size increase of a lattice parameter to the applied temperature. It can be calculated using the following formula:
\[ \frac{\Delta L}{L_0} = a_0 + a_1 T + a_2 T^2 + a_3 T^3 \]
∆L=L(T)- L0
L(T) … length of lattice axis at temperature T
L0 … length of lattice axis at 293 K
T … temperature in K
a1-3 … coefficients of thermal expansion
The thermal expansion curve for the c-axis of corundum looks, e.g., as follows:
\[ \frac{\Delta L}{L_0} = -0.192 + 5.927 \times 10^{-4} T + 2.142 \times 10^{-7} T^2 - 2.207 \times 10^{-11} T^3 \]
∆L=L(T)- L0
L(T) … length of c-axis at temperature T
L0 … length of c-axis at 293 K
T … temperature in K
Reversely, the determination of the lattice parameter allows the calculation of the temperature. As axis dimensions are available from Rietveld refinement, the true temperature on the surface of the sample can be determined.
Requirements for reference material
Reference materials for temperature validation by thermal expansion have special requirements. Most importantly, the thermal expansion coefficients of the material must be well-known. To make analysis easier, and reduce statistical errors, it is also helpful to use materials that show high thermal expansion. The material should also display stable lattice parameters with no phase transitions or chemical reactions occurring during the heating process.
Procedure
The step-wise procedure for validation by lattice expansion is given below:
- Run long range 2θ scans at 25 °C (reference) and the temperatures of interest
The following analysis steps requires high data quality, so measurement parameters should be adjusted to ensure the scans provide high resolution and good signal-to-noise ratio. - Determine the lattice parameters with Rietveld refinement
- Calculate the relative lattice expansion
Depending on the material used for validation, the different lattice axes may expand differently. It is usually sufficient to focus on one of the axes, with whatever axis shows the most expansion usually giving the best results for validation. Values for lattice expansion coefficients are available in literature. - Use the inverted expansion curve to calculate the true sample temperature and compare it to the displayed scan temperature.
Advantages and limitations
- The complete temperature range can be calibrated with one standard sample
- Method applicable to very high temperatures
- Good data quality required for the refinement
- Considerable data evaluation required
- Inaccurate at low temperatures (<400°C) due to small lattice expansion
Results of this type of temperature validation will be shown in chapter 1.3.
Temperature Validation Data for Different Heater Types
Influence of gas atmosphere
The influence of different gas atmospheres on the temperature accuracy is discussed for a strip heater. The following conditions were evaluated: He (atmospheric pressure), N2 (atmospheric pressure) and vacuum. It is expected that the temperature deviation between the measured temperature of the temperature sensor (spot-welded to the bottom side of the heating strip) and the temperature on the sample surface should be highest under vacuum. The reason is that convection, which would help to transfer heat from the strip to the sample, is completely missing. As the thermal conductivity of He (5.193 KJ/kgK) is much higher compared to N2 (1.040 KJ/kgK), He should give the best results.
In the following figure (Figure 3) the effect of different gas atmospheres on temperature accuracy is shown for a measurement of the thermal expansion of MgO.
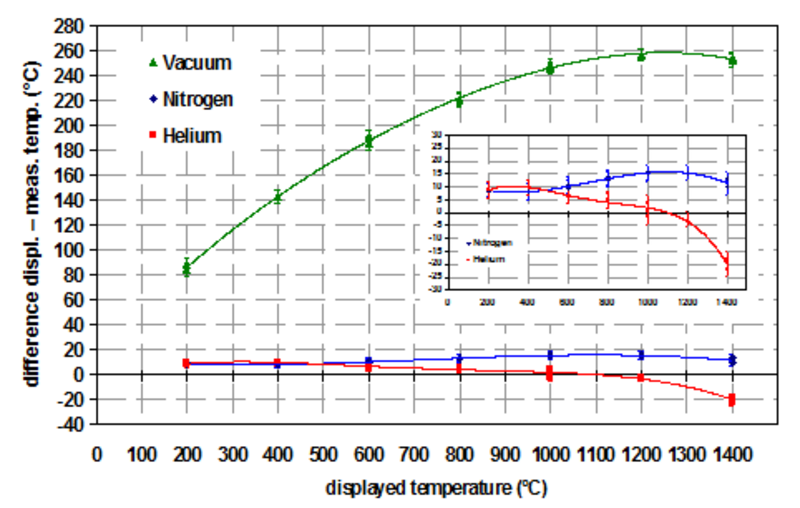
It can be easily seen in Figure 3 that the assumptions from above are confirmed.
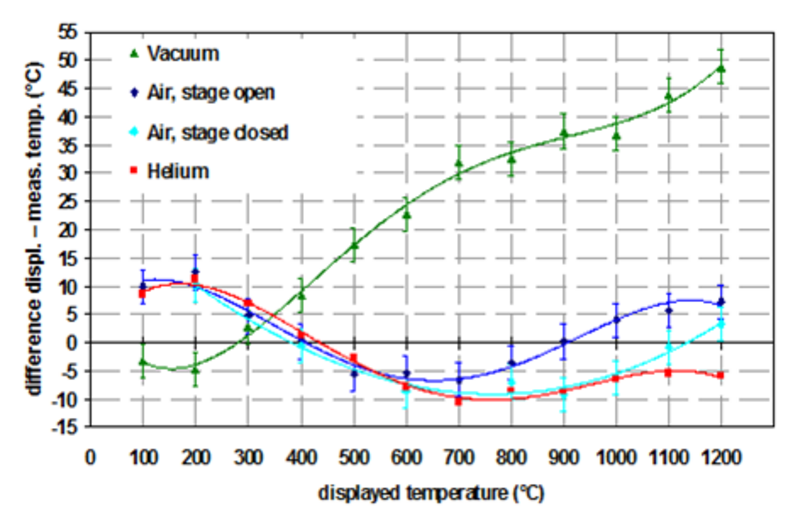
One can observe the same trends for environmental heaters, but in that case the absolute deviations are much smaller due to the better temperature homogeneity in environmental heaters. In this case the thermal expansion of the c-axis of Al2O3 was used for the validation (Figure 4).
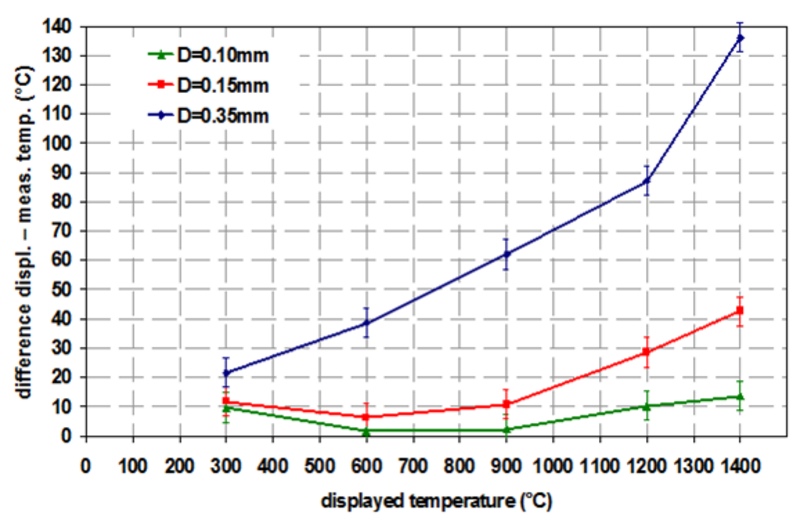
Influence of sample thickness
One big advantage of environmental heaters is that the thermal properties of the sample are not that important for the temperature deviation. This is especially true for the sample thickness. For direct heaters the sample thickness has a big impact on the temperature deviation as can be seen from Figure 5. In this example the thermal expansion of Al2O3 was measured with a strip heater (=direct heater) under helium atmosphere.
It can be clearly seen that the thickness of the sample has a significant influence on the temperature deviation. Therefore, for direct heaters the best way of sample preparation is as follows: the sample should be applied as thinly as possible, but still covering the complete heating strip. Otherwise additional signals from the heating strip are visible in the diffractogram and make data interpretation more difficult.
References
- Pein, A, Puhr, B, Jones, A: The Non-ambient Guide: Principles of Non-ambient X-ray Diffraction. https://www.anton-paar.com/corp-en/the-non-ambient-guide/ (accessed 10.12.2024)
- Eysel, W., Breuer, K.-H., Differential scanning calorimetry: Simultaneous temperature and calorimetric calibration: Eds.: J.F. Johnson, P.S. Gill, Plenum Publishing Corporation,67-80, 1984
- Breuer, K.-H., Eysel, W., The calorimetric calibration of differential scanning calorimetry cells. Thermochimica Acta, 57 (1982), 317-329
- Weast, R.C. Handbook of Chemistry and Physics. EDs. Weast, R.C., CRC Press, 18901 Cranwood Parkway, Cleveland, Ohio, 44128