The influence of particles on suspension rheology
Adding particles to liquids modifies the liquids’ optical and physical properties, e.g. color, density, and viscoelasticity. Solvents, such as water or acetone, are typically ideally viscous liquids, while particle-bearing liquids display a more complex rheological behavior. If the particles are soluble in the solvent, the final product is termed a solution. Particles are dissolved as molecules or ions (<1 nm). In case the particles are insoluble, the product is a two-phase (or multi-phase) mixture which is termed a suspension if particles are larger than 1 µm or termed a colloid if particles are between 1 nm and 1 µm in size.
Many liquid products, paints, inks, beverages, medicine, slurries, or shower gels contain various types of particles to achieve the desired final product or adjust processing properties. A low particle volume fraction (termed “solid fraction” hereafter) typically induces shear-thinning behavior, whereas high particle concentrations might result in shear thickening. However, the materials’ viscoelasticity not only depends on the concentration of particles but also on particle shape and particle size. In most suspensions, particles differ in size, which can be expressed as the particle size distribution. Furthermore, the particle surface’s electrical charge (zeta potential) influences the suspension’s rheological behavior. This article aims to separate the effects of particle concentration, particle shape, particle size distribution, and particle surface charge, and to name common methods to measure these properties.
Particles – the solid fraction in suspensions
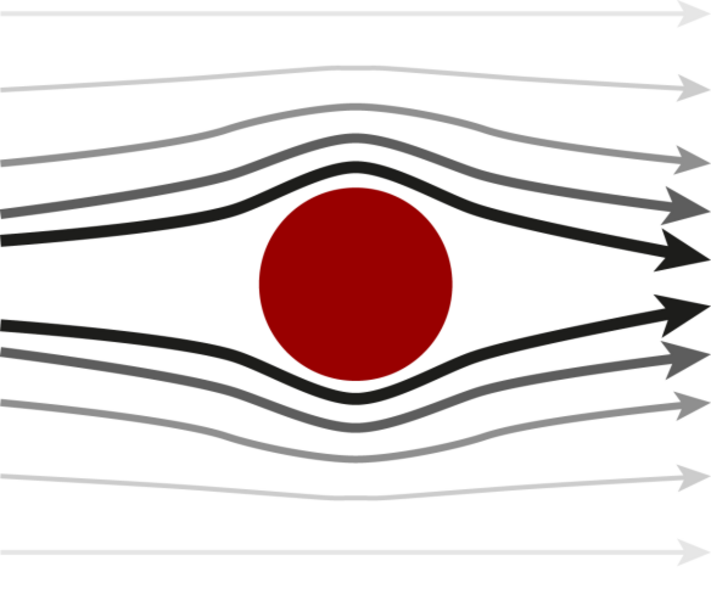
Particles in a liquid act as obstacles, hindering the liquid’s flow and therefore increasing the flow resistance, i.e. the viscosity. A simple model to describe the increased viscosity is to assume a flow field around a single sphere, representing very low particle concentrations, and an increased resulting viscosity simply calculated from the viscosity of the solvent and the volume fraction of the dispersed solid (Figure 1, Equation 1, Einstein 1906, 1911).
The formula was modified and adapted for multiple spheres of the same size (“monodisperse”) for maximum solid fractions of 0.15 to 0.2 (Equation 2) by Batchelor (1977), with η representing the bulk viscosity of the suspension, η0 the viscosity of the liquid, and φ the solid fraction in the suspension.
Equation 1: $\eta = \eta_0(1+\frac{5}{2}\varphi)$
Equation 2: $\eta = \eta_0(1+2.5 \varphi + 6.2\varphi^2)$
Suspensions with an even higher solid fraction can be described with the model of Krieger & Dougherty (1959, Equation 3), valid for low and high shear rates. In this model, two additional input parameters are required. Φmax is the maximum solid fraction in the suspension, still allowing the suspension to flow. The intrinsic viscosity [η] is a measure for the particle shape (2.5 for spheres).
Equation 3: $\eta = \eta_0(1- \frac{\varphi}{\varphi_{max}})^{-[\eta]*\varphi_{max}}$
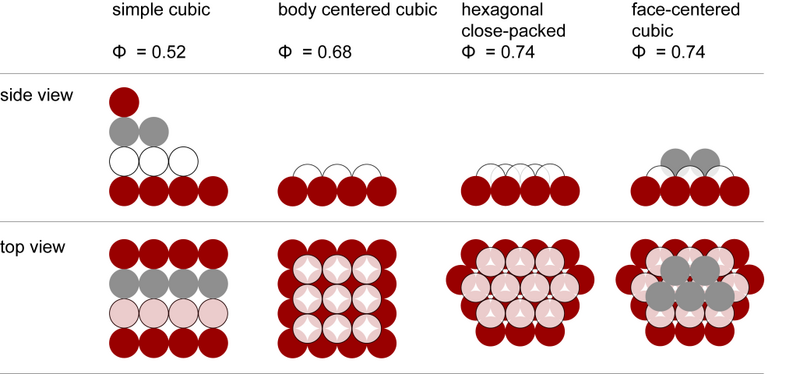
Assuming spherical particles, the theoretical maximum packing density can be 0.52 to 0.74, depending on the sphere stacking scheme (Figure 2). It is well-established that for random close packing of spheres the value is about 0.64 (e.g. Scott & Kilgour 1969).
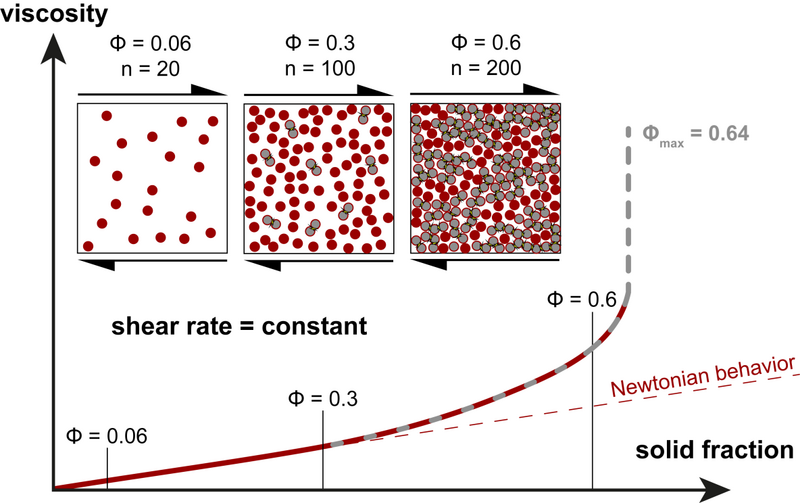
For low solid fractions, the viscosity of the suspension is increased. However, no significant particle-particle interactions occur and the flow behavior of the suspension is still controlled by the Newtonian flow behavior of the solvent phase. With increasing solid fraction, it is more likely that particles collide. They now act as obstacles and additional shear force is required when friction occurs during particle collision (Figure 3). When the solid fraction approaches φmax, ongoing particle-particle interactions substantially increase the force required to shear the sample, now dominating over the shear stress required to shear the solvent.
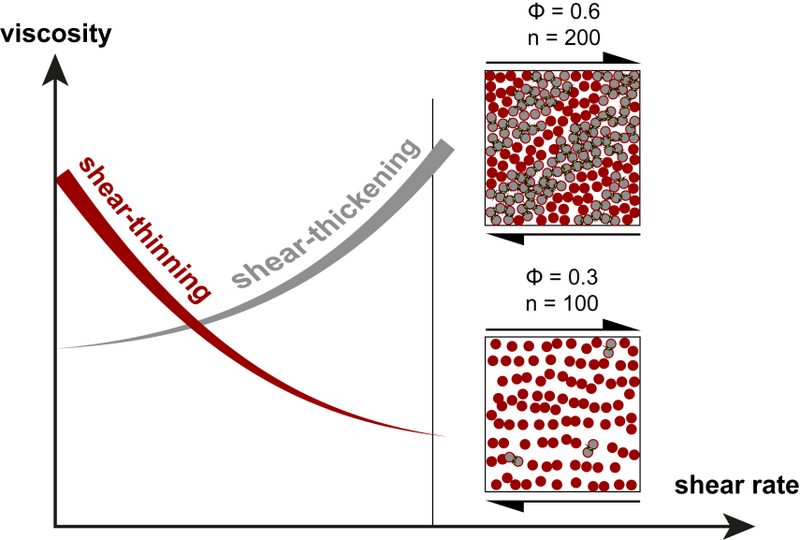
The suspension’s rheological response is now also shear-rate-dependent, the onset of non-Newtonian flow behavior, e.g. shear-thinning character of the suspension, is highly variable for different suspensions but may start at φ = 0.1 to 0.5 (e.g. Stickel & Powell 2005). In addition, at higher shear rates particles form clusters and jamming occurs, leading to shear thickening (Figure 4). The transition from shear-thinning to shear-thickening is sample-specific and controlled by factors like particle size (distribution) and particle shape.
Particle size and particle size distribution
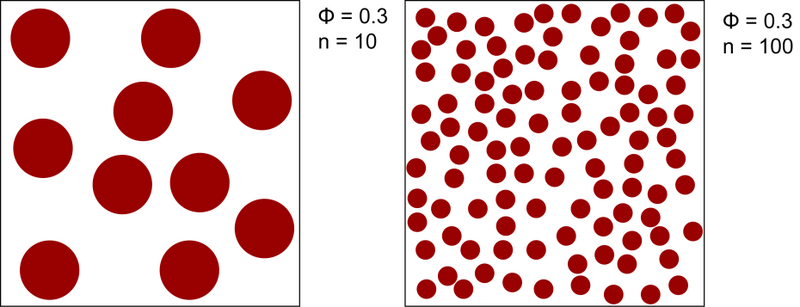
For a given solid fraction, smaller particle size leads to a higher number of particles in a given volume (Figure 5). Therefore, the particle surface area can be several orders of magnitude higher for smaller particles. Very small particles display Brownian motion acting against an applied shear force (Perrin 1910). Therefore, surface charge, adsorption, and hydration have a potentially strong effect on the effective hydrodynamic particle size for small particles in particular.
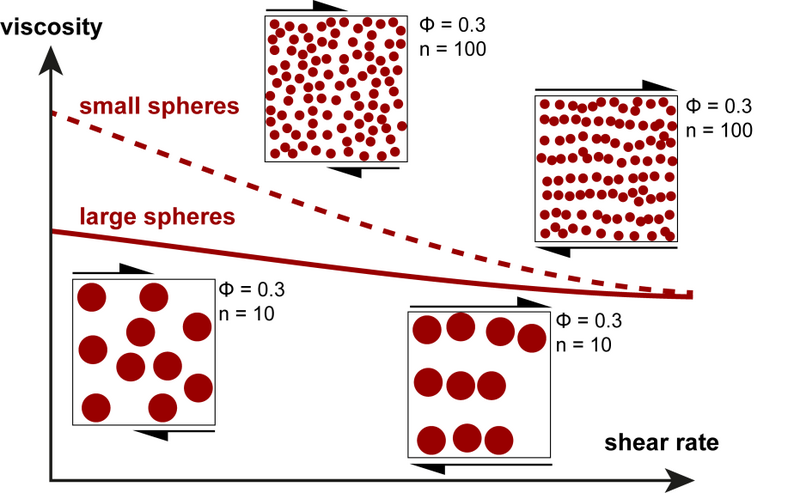
We have already shown that at a certain value of solid fraction, when particle-particle interaction becomes significant, shear-thinning behavior is observed. The viscosity difference between small and large particles is diminished at higher shear rates as particles are favorably rearranged with respect to the flow direction (Figure 6). However, for the majority of all existing suspensions, particle size is not uniform and is best described as particle size distribution (PSD, Figure 7). The maximum packing density, and thus the maximum solid fraction, benefits from particles with variable size (“polydispersity”) as the space can be filled more efficiently.
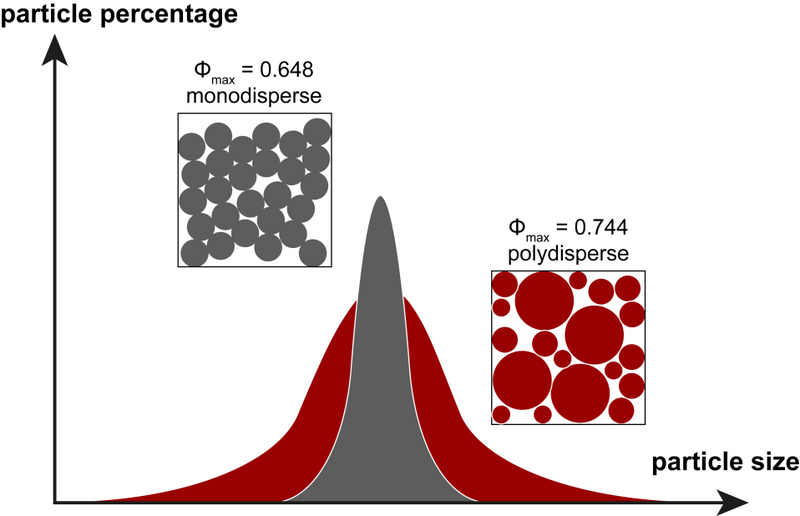
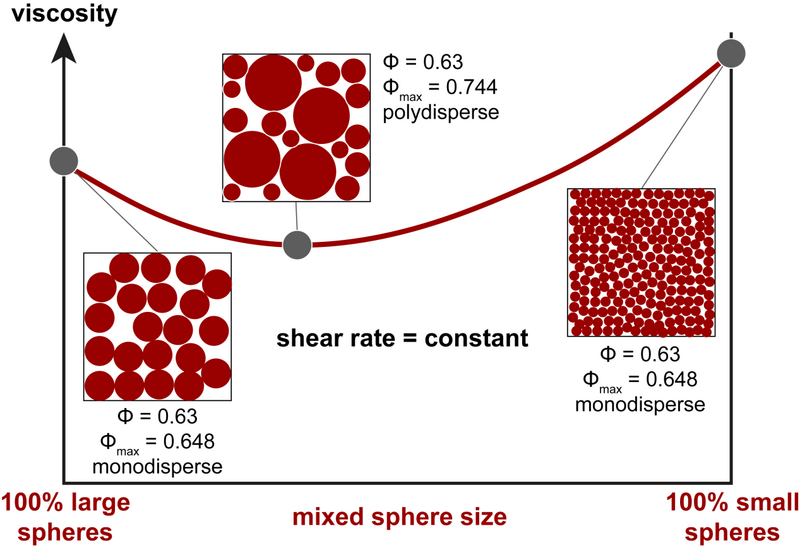
In terms of the Krieger & Dougherty equation (Equation 3), φmax increases (it may be above 0.74!) and thus reduces the measured viscosity for a given particle concentration. The broader the particle size distribution (PSD), the larger the positive effect on the packing density (Figure 7). We already learned that smaller particles result in a higher viscosity for a given shear rate and solid fraction. If we now compare the viscosity of two monodisperse and a polydisperse PSD, a viscosity minimum is evident for the polydisperse mixture (Figure 8). However, such polydisperse suspensions may still have a high yield stress (Ancey & Jorrot 2001) and for colloidal suspensions with bimodal particle size distributions the smaller particles may act as a lubricant (Ancey 2001).
Particle shape and surface properties
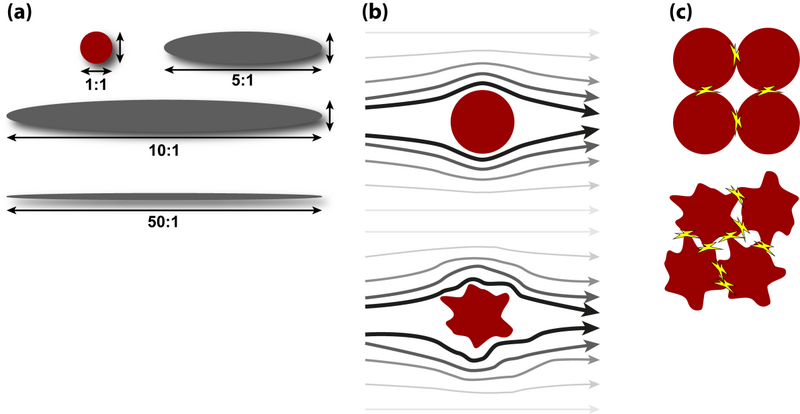
Until now we considered idealized spherical particles. Obviously, particles often display uneven convexity or non-spherical shape (elongation). The intrinsic viscosity [η] is a factor to describe the particle shape. For example spheres are represented by a value of 2.5 and ellipsoids with a 5:1, 10:1, 50:1 aspect ratio by values of 2.94, 3.43, 7.00 (Figure 9a).
For aspect ratios (R) from 1:1 to 20:1, the intrinsic viscosity can be expressed with the following function (Brenner 1974, Pabst et al. 2006, Equation 4):
Equation 4: $[\eta] = 2.5 + 0.123(R-1)^{0.925}$
Irregularities of the particle surface lead to a higher viscosity for two reasons: The deflection of the flow lines of the solvent flowing around particles is stronger than for same-size spheres (Figure 9b), and the increased specific particle surface increases the probability of particle-particle interactions (Figure 9c). The effect is stronger for high particle concentrations and high shear rates.
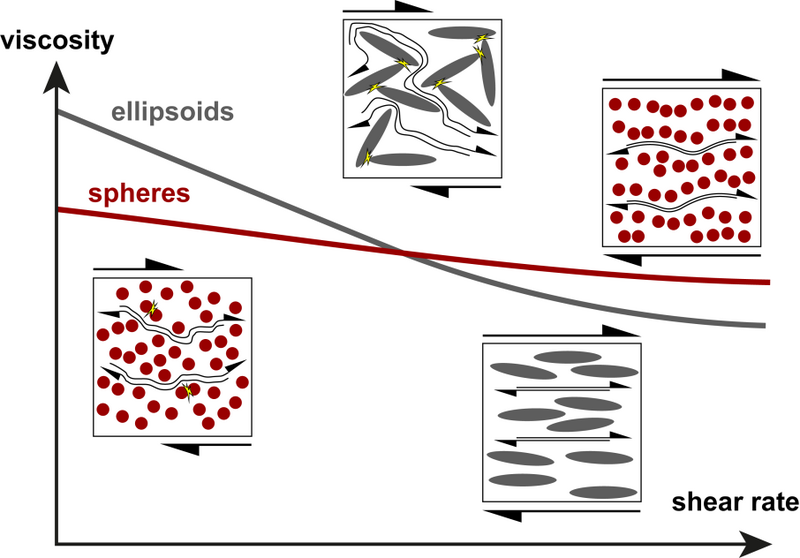
If we now compare the shear-rate dependence of spheres and elongated particles, we recap that spheres show shear-thinning as particle-particle interactions become less pronounced at high shear rates. The increased surface of elongated particles leads to higher low-shear viscosity compared to spheres. However, non-spherical particles have the possibility to adapt their orientation to a flow direction. At rest, they are randomly oriented but align to the flow direction when a shear rate is applied. This leads to lower viscosity compared to spheres at higher shear rates because the intrinsic viscosity is then lower – resulting from the higher maximum packing density φmax (Figure 10).
The effect of electrical particle charge
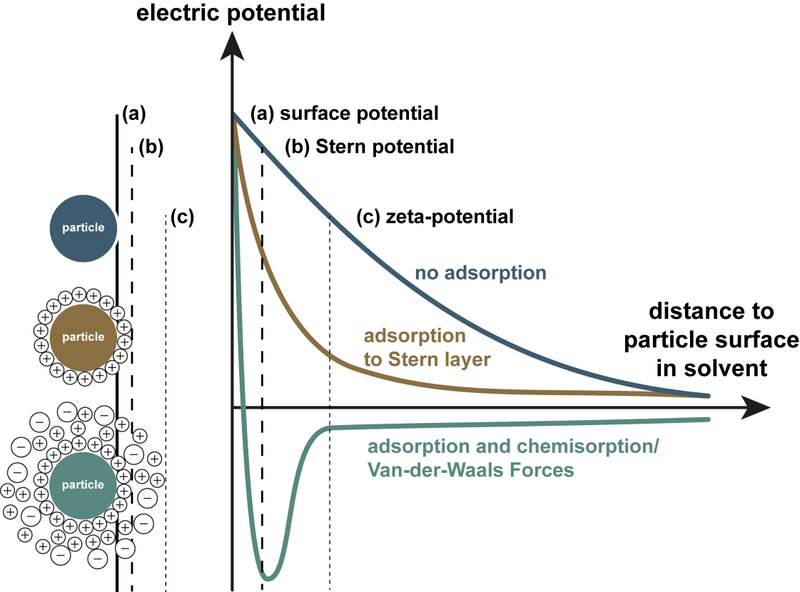
Depending on the application of the suspension, a wide variety of substances are used for both solvents and particles, possibly having an electrical charge. The electrostatic momentum, which can represent attraction or repulsion within a suspension, is quantified as zeta potential. If particles have a positive or negative surface charge, molecules or ions with negative or positive charge occupy the surface (Figure 11) and together form a particle with a non-zero surface potential.
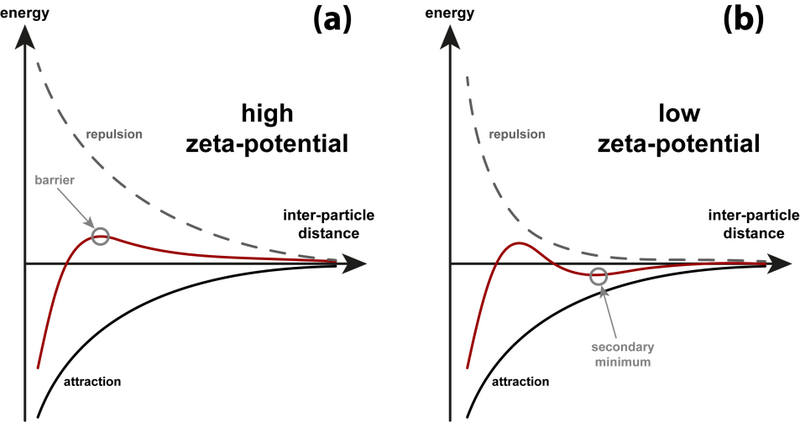
This electrical potential affects the interaction with the solvent as well as the inter-particle behavior. If the surface charge is high, repulsion between particles dominates over attraction by van-der-Waals forces (Figure 12a) and an energetic barrier prevents close proximity of the particles. In contrast, for particles with near-zero surface charge, repulsion is weaker and an energy minimum for a certain particle-particle distance facilitates an ordered particle arrangement (Figure 12b).
In consequence, for a sample with a low zeta potential, accumulation or flocculation of particles is favored, whereas at a high zeta potential, particles may repel each other and effectively avoid agglomeration. However, to understand the rheological behavior of the suspensions, we additionally need to take into account particle size and solid fraction.
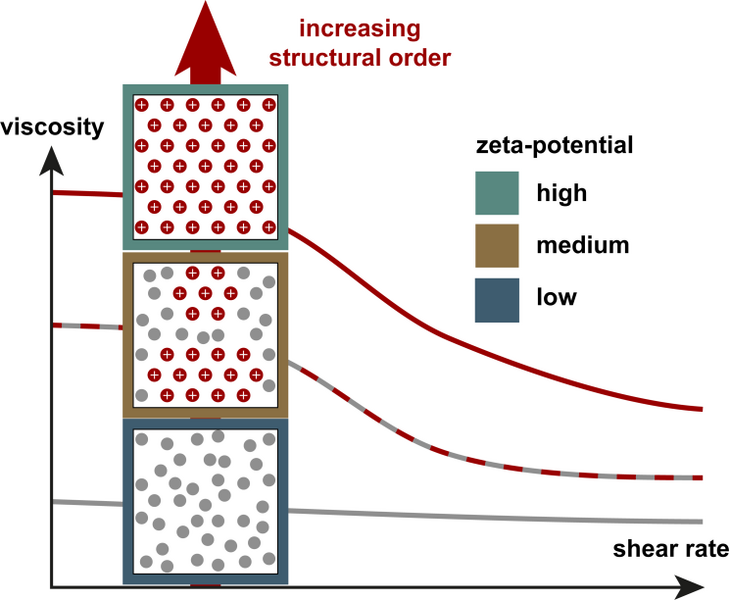
Dispersions with small particles (<1 µm) are particularly sensitive to changes in zeta potential as induced particle repulsion and increased hydrodynamic volume (Maranzano & Wagner 2001, Figure 13) will increase the viscosity, in particular at low shear rates. This is only possible as gravitational forces act subordinate to such small and light particles, while Brownian motion will dominate. Assuming relatively low solid fractions, this kind of dispersion will maintain a zero-shear viscosity plateau.
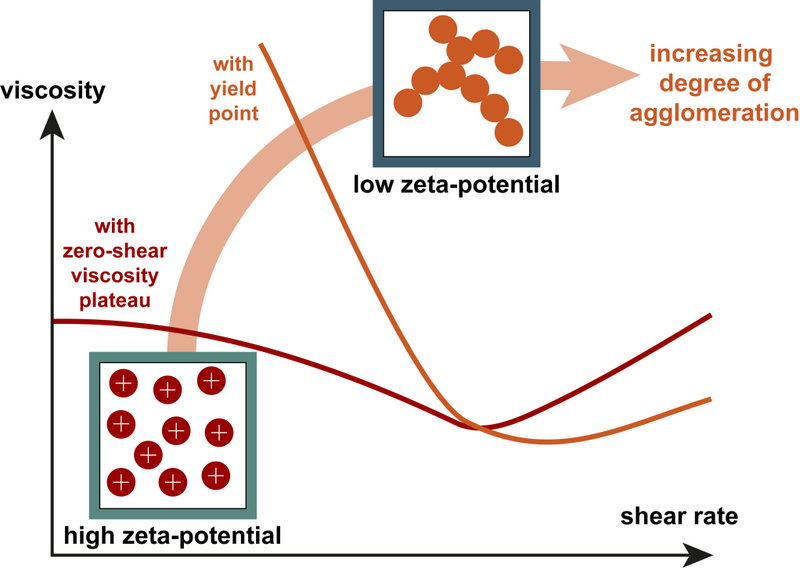
In contrast, for larger particles the effect of sedimentation is generally stronger and together with the zeta potential it will control the agglomeration behavior. At a low zeta potential, particles stick together and by steadily increasing the size of the agglomerate, gravitation will finally cause sedimentation. Such agglomeration may induce a yield point if the solid fraction is sufficiently high and the particles are able to form a three-dimensional network. Note the contrasting behavior at high shear rates, where shear thickening may occur, as inter-particle repulsion causes higher viscosities for samples with a high zeta potential (Figure 14).
Methods to characterize suspensions
Bulk physical properties of the suspension and the solvent, like viscosity and yield point, can be measured with viscometers or rheometers in rotational or oscillatory tests. Characterization of the solid fraction requires knowledge of particle size, particle size distribution (PSD), and particle shape. These properties require additional methods like dynamic light scattering or laser diffraction (for particle size and PSD) and high-resolution imaging (also particle shape) to be measured. Furthermore, electrophoretic light scattering is used to determine the zeta potential.
Laser diffraction is able to analyze particles from the sub-µm to the mm size range. The measuring principle is based on having a laser directed to the sample and multiple detectors to record scattering at different angles. The light scattering behavior differs with respect to the particle size: smaller particles scatter more strongly than larger particles. However, the measurement is based on the assumption of spherical particles and knowledge of the optical properties of the solvent as well as the particles is required.
Dynamic light scattering allows particle size measurement down to the sub-nm range. The measuring principle uses intensity fluctuations over very short timescales due to Brownian motion. Hence, the particle speed can be correlated with particle size.
For electrophoretic light scattering, two electrodes are connected to the sample and an electrical field is applied. Charged particles will now move towards either the positive or negative electrode, the velocity is measured with the laser Doppler technique as frequency shift or as phase shift. The obtained values can be converted to zeta potential distribution or an average zeta potential, respectively.
Automated imaging allows determination of particle shape and particle size if particles are at least 1 µm in diameter. Several thousand images are taken to ensure statistically sound values. This method is particularly useful if particles show strong deviation from sphericity. Except for dynamic light scattering (only applicable to wet samples), these methods can be used for both dry and wet samples.
Conclusion
Many liquid products contain a certain fraction of particles and understanding of the viscoelastic behavior of these suspensions is of vital importance for a wide range of industrial, natural, and biological products and processes. Particle fraction, shape, size (distribution), and surface charge influence a suspension’s rheological behavior, which is typically shear-thinning but can also be Newtonian for low particle fractions, or is shear-thickening for high particle fractions at high shear rates. A combination of methods for determining the rheological properties and the particle properties is necessary for a comprehensive characterization of suspensions.
References
Ancey C (2001) Role of lubricated contacts in concentrated polydisperse suspensions. Journal of Rheology 45: 1421–1439. doi: 10.1122/1.1413504
Ancey C, Jorrot H (2001) Yield stress for particle suspensions within a clay dispersion. Journal of Rheology 45: 297–319. doi: 10.1122/1.1343879
Batchelor KG (1977) The effect of Brownian motion on the bulk stress in a suspension of spherical particles. Journal of Fluid Mechanics 83: 97–117. doi: 10.1017/S002211207700106
Brenner H (1974) Rheology of a dilute suspension of axisymmetric Brownian particles. International Journal of Multiphase Flow 1: 195–341. doi: 10.1016/0301-9322(74)90018-4
Einstein A (1906) Eine neue Bestimmung der Moleküldimensionen. Annalen der Physik 324: 230–247. doi: 10.1002/andp.19063240204
Einstein A (1911) Berichtigung zu meiner Arbeit: Eine neue Bestimmung der Moleküldimensionen. Annalen der Physik 339: 591–592. doi: 10.1002/andp.19113390313
Krieger IM, Dougherty TJ (1959) A mechanism for non-Newtonian flow in suspensions of rigid spheres. Transactions of the Society of Rheology 3: 137–152. doi: 10.1122/1.548848
Maranzano BJ, Wagner NJ (2001) The effects of interparticle interactions and particle size on reversible shear thickening: Hard-sphere colloidal dispersions. Journal of Rheology 45: 1205–1222. doi: 10.1122/1.1392295
Pabst W, Gregorova E, Berthold C (2006) Particle shape and suspension rheology of short-fiber systems. Journal of the European Ceramic Society 26: 149–160. doi: 10.1016/j.jeurceramsoc.2004.10.016
Perrin J (1910) Brownian movement and molecular reality. Taylor & Francis, 93 p. ISBN: 9780486174723
Scott GD, Kilgour DM (1969) The density of random close packing of spheres. Journal of Physics D: Applied Physics 2: 863. doi: 10.1088/0022-3727/2/6/311
Stickel JJ, Powell RL (2005) Fluid mechanics and rheology of dense suspensions. Annual Review of Fluid Mechanics 37: 129–149. doi: 10.1146/annurev.fluid.36.050802.122132