Evaluation of the time-dependent flow behavior
Methods for evaluating time-dependent structural regeneration (according to DIN spec 91143-2) evaluate structural regeneration in the third test interval based on viscosity.
Three methods M1 to M3 can be applied: The viscosity at rest at the end of the first test interval is used as the reference value for M1 and M2. (M1) Determination of structural regeneration as a percentage of that reached at a previously defined time-point or, alternatively, at the end of the third test interval (Figure 1).
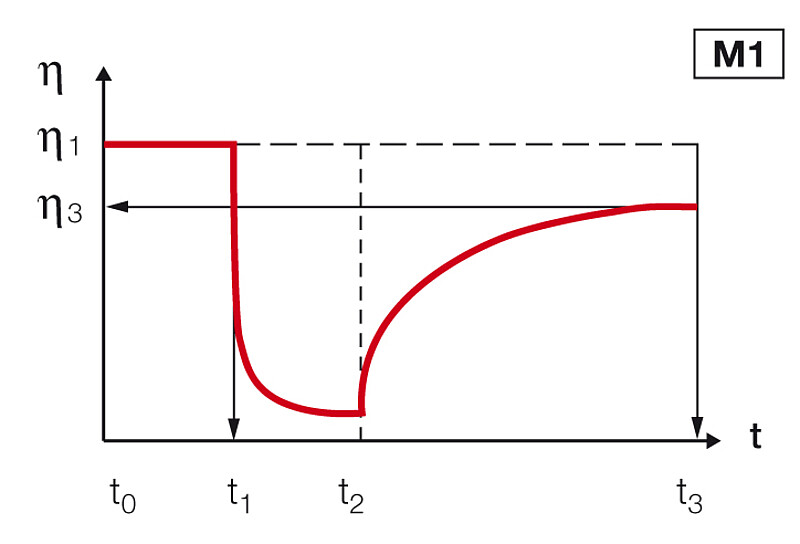
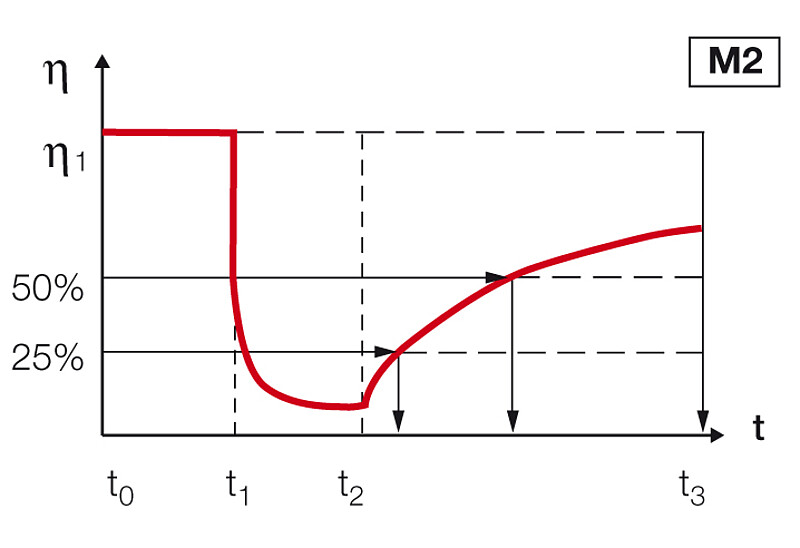
Example for M1: After 60 s in the third test interval, regeneration reached 80 % of the reference value. (M2) Determination of the time-points for a defined regeneration as a percentage (Figure 2)
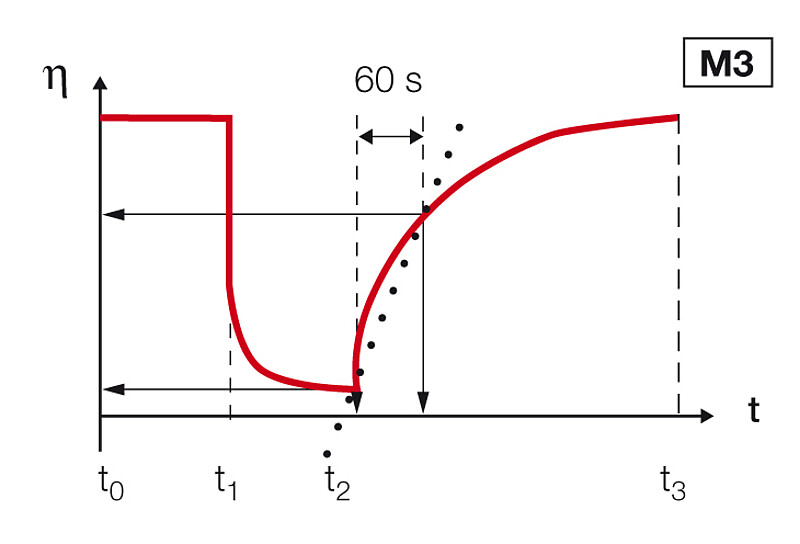
Example for M2: 25 % regeneration was achieved after 10 s, and 50 % regeneration after 30 s. (M3) Slope of the time-dependent viscosity function during regeneration within a previously defined time interval (Figure 3).
Example for M3: In the third test interval, the viscosity increases from Δη = 200 to 500 mPas in the period Δt = 60 s; the difference is Δη = 300 mPas. This results in a value for the curve slope of (Δη / Δt) = (300 mPas/60 s) = 5 mPas/s.
Definition of thixotropic behavior, in this case relating to viscosity (according to DIN spec 91143-2 and prEN ISO 3219-1): Thixotropic behavior is characterized by a decrease in the values of rheological parameters such as shear viscosity against a constant, time-independent limiting value due to constant mechanical load and the complete time-dependent recovery of the initial state upon reduction of the load. Correspondingly, the following applies to rheopectic behavior which, however, is rarely found in practical applications: Rheopectic behavior is characterized by an increase of the values of rheological parameters such as shear viscosity against a constant, time-independent limiting value due to constant mechanical load and the complete time-dependent recovery of the initial state upon reduction of the load (see 3iTT test).
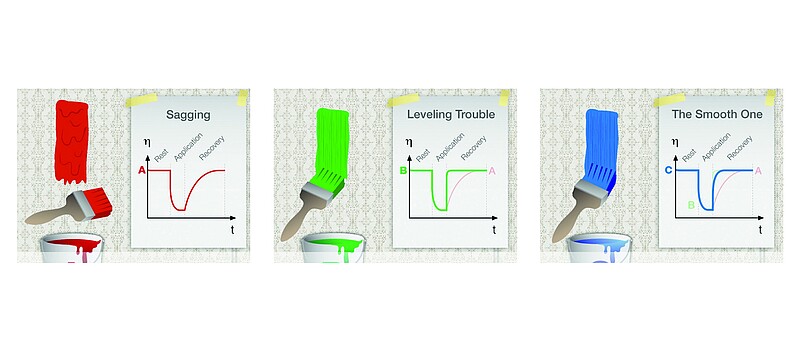
Leveling and sagging of coatings after application
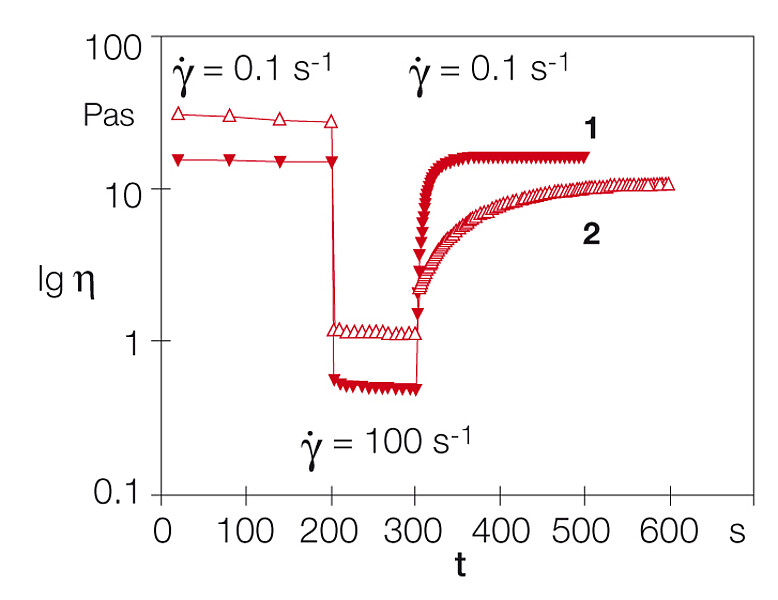
The preset shear rate in both the first and third test intervals was 0.1 s-1, whereas it was 100 s-1 in the second interval. Paint 1 shows fast structural regeneration. This means that the paint has a low tendency to sagging after coating, and that a high wet-layer thickness can be achieved. However, in the case of the structural regeneration being too fast, it is also possible that the leveling of the coating may be insufficient, with remaining brush marks. Regarding paint 2, the slower increase in viscosity may indicate better leveling.
On the other hand, this paint is prone to sagging. Figures 5 and 6 illustrate the practical effects of time-dependent structural regeneration after application for three brush paints. Red paint A has too slow a regeneration and it will sag too much and over too long a time. Green paint B, on the other hand, has too quick a regeneration, resulting in insufficient leveling and the occurrence of brush marks. Blue paint C, finally, has a balanced regeneration time that is neither too long nor too short. Thus, it displays the desired behavior with sufficient leveling and a negligible tendency to sagging.
Comparison of the structural regeneration of two paints using their time-dependent viscosity curves: After shearing, the structure of paint 1 regenerates completely within 60 s, while paint 2, even after 300 s, has reached only one third of its initial viscosity at rest. Please note: The diagram is plotted on a semi-logarithmic scale (Figure 4).

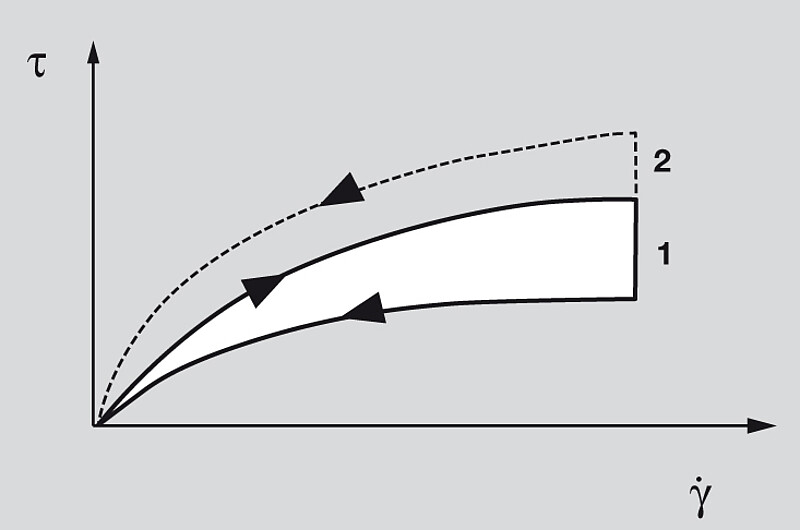
On the subject of the evaluation of thixotropic behavior using the method of hysteresis area (or thixotropy area; Figure 7): Hysteresis means the loop of a curve which starts and ends at the same point.
Three test intervals are used: An upwards ramp preset for a flow curve with increasing shear rates, a high shear phase at a constant high shear rate, and a downwards ramp for a flow curve with decreasing shear rate. For the evaluation, the area between the upwards flow curve and the downwards flow curve is determined as the so-called hysteresis area. The decisive disadvantage of this method is that it is only the structural breakdown that is evaluated, and not the subsequent structural regeneration at rest. The latter, however, is much more important for users of coatings. This is because it is only in this phase that practical effects such as leveling and sagging can be identified.
Conclusion
In compliance with all modern standards, thixotropy is no longer defined as a measure for structural breakdown but rather as a measure for structural regeneration. Therefore, using the hysteresis area for the evaluation of thixotropy is not only outdated but, according to today’s definitions, wrong. Even when carrying out very simple quality control tests, you should be aware of the meaningfulness of the results obtained. Therefore, the term thixotropy should no longer be used when applying the hysteresis method.