Time-dependent behavior (oscillation)
Time-dependent structural regeneration after shearing, and thixotropic behavior
Step test with preset oscillation for all three test intervals
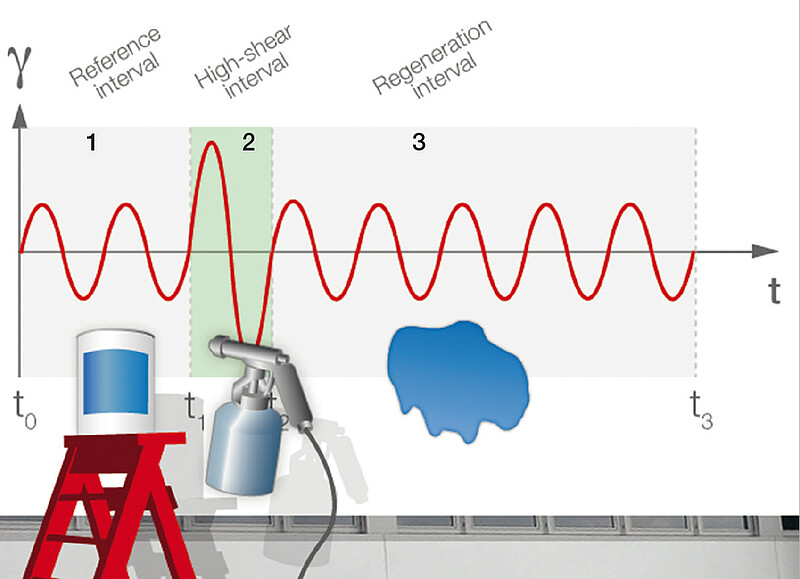
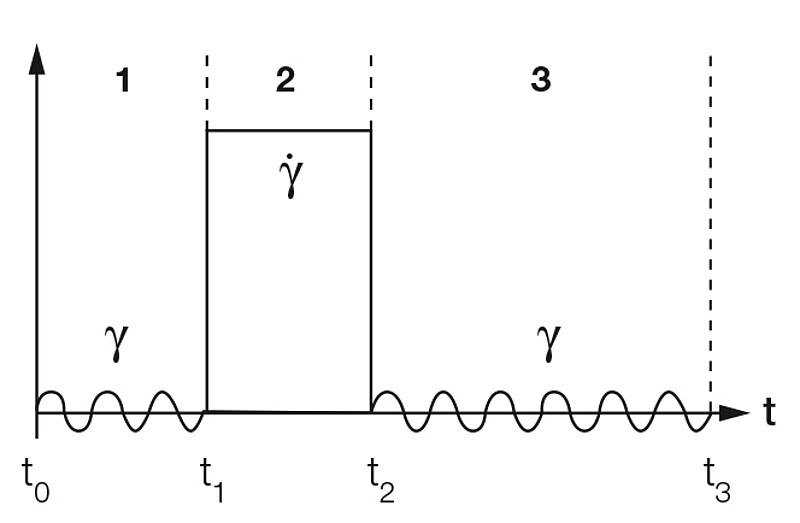
Step tests are used for evaluating the breakdown of the inner structure of a sample under high shear and its subsequent recovery. It can be performed as an oscillatory test with the following three test intervals. Usually a time-dependent strain profile is preset (Figure 1).
- Very low shear to simulate behavior at rest at low strain within the LVE region,
- Strong shear to simulate structural breakdown of the sample during application at high strain far beyond the LVE region,
- Very low shear to simulate structural regeneration at rest using the same low strain value as in the first test interval.
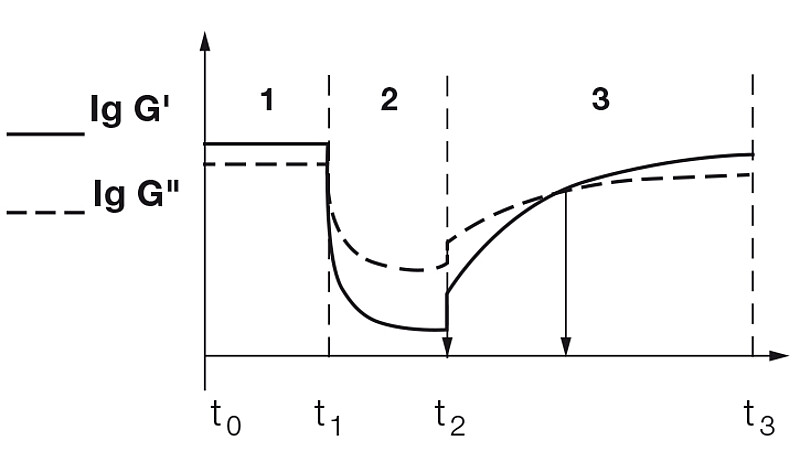
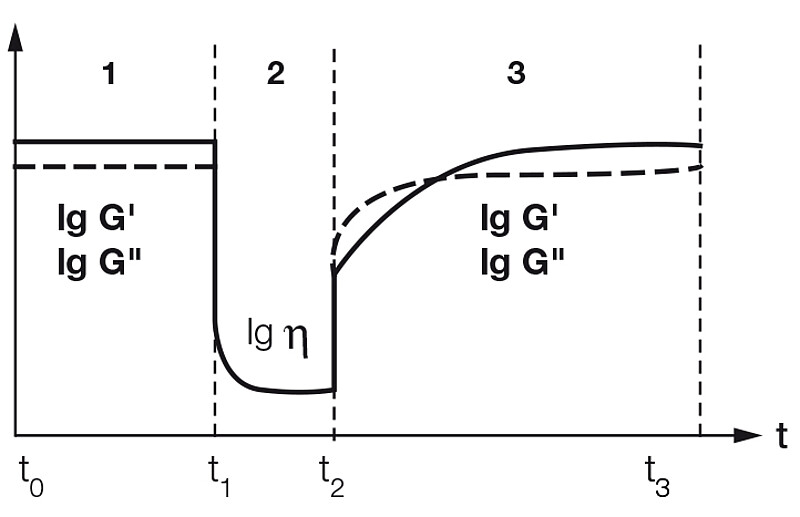
Usually, the same (angular) frequency is preset for all three test intervals. The result is commonly presented as time-dependent functions of G' and G'' (Figure 2):
- Behavior nearly at rest,
- Behavior during structural breakdown when shearing is stronger,
- Behavior during structural recovery nearly at rest.
The diagram shows a solid structure in the first test interval (with G' > G''), a liquid structure in the second interval (with G'' > G'), and finally a solid structure again after exceeding the crossover point G' = G''.
Definition of thixotropic behavior, in this case relating to the storage modulus G' (according to DIN spec 91143-2 and prEN ISO 3219-1): Thixotropic behavior is characterized by a decrease in the values of rheological parameters such as storage modulus G' against a constant, time-independent limiting value due to constant mechanical load, and the complete time-dependent recovery of the initial state upon reduction of the load.
Correspondingly, the following counts for rheopectic behavior which, however, is rarely found in practical applications: Rheopectic behavior is characterized by an increase in the values of rheological parameters such as G' against a constant, time-independent limiting value due to constant mechanical load, and the complete time-dependent recovery of the initial state upon reduction of the load.
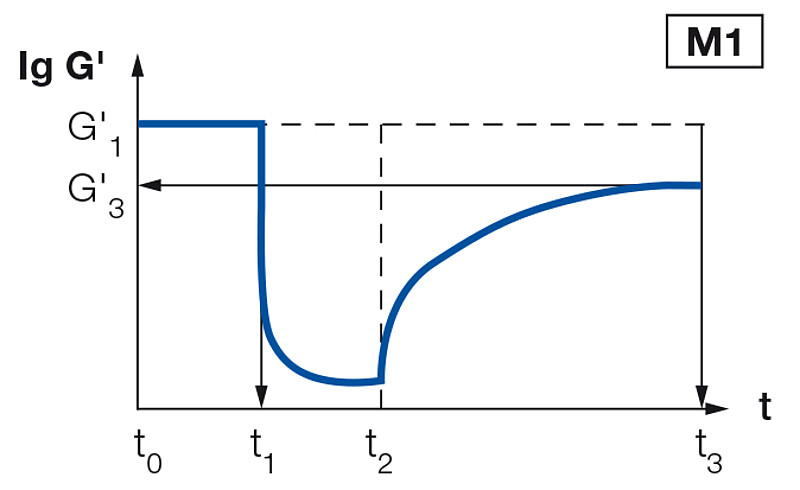
Methods for evaluating time-dependent structural regeneration (according to DIN spec 91143-2) In order to evaluate structural regeneration in the third test interval based on G' values, the following methods, M1 to M4, can be applied: The G' value at rest at the end of the first test interval is used as a reference value for M1 and M2. M4 is the preferred method for evaluating thixotropic behavior.
(M1) Determination of structural regeneration as a percentage of that reached at a previously defined time-point or, alternatively, at the end of the third test interval (Figure 3). Example of M1: After 60 s in the third test interval, regeneration reached 80 % of the reference value.
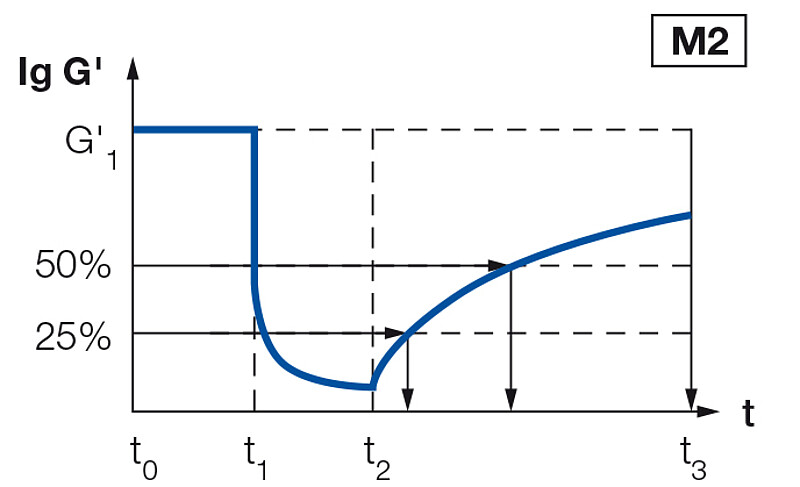
(M2) Determination of the time-points for a defined regeneration as a percentage (Figure 4) Example of M2: A 25 % regeneration was achieved after 30 s, and a 50 % regeneration after 90 s.
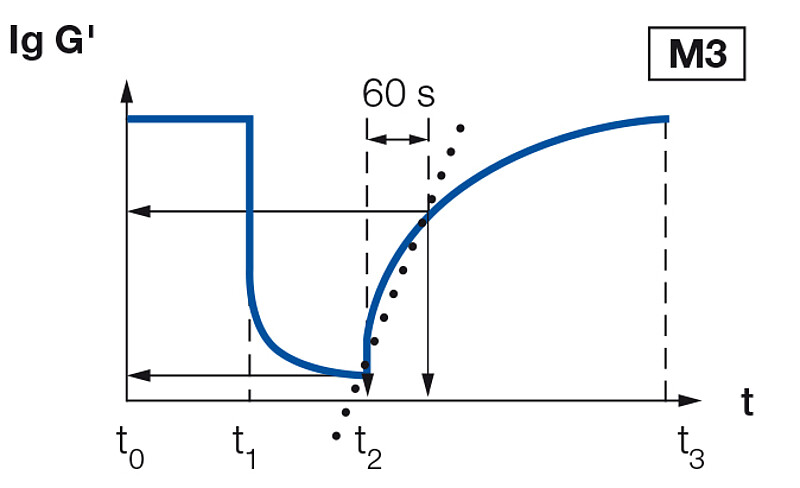
(M3) Slope of the time-dependent G' function during regeneration within a previously defined time interval (Figure 5) Example of M3: In the third test interval, the G' value increases in the period Δt = 60 s from G' = 20 Pa to 50 Pa; the difference is ΔG' = 30 Pa. From the diagram, this results in a value for the slope of (ΔG' / Δt) = (30 Pa/60 s) = 0.5 Pa/s.
(M4) Time-point at the crossover point of G' and G'' in the third test interval (Figure 2). Example of M4: In the third test interval, the crossover point G' = G'' is reached after 30 s.
Step test as an ORO test
Often a process needs to be simulated with a focus on practical aspects. In such a case, it makes sense that the step test is modified accordingly because, even with a high strain amplitude in the second test interval, shear rates above 100 s-1 cannot really be achieved. Therefore, a mixed test is recommended; for example with the following three test intervals: Oscillation / Rotation / Oscillation, also known as an ORO test (Figure 6):
- Oscillation at very low shear to simulate behavior at rest, performed at a low strain value from the LVE region.
- Rotational test at strong shear to simulate structural breakdown of the sample during application, performed at a high shear rate.
- Oscillation at very low shear to simulate structural regeneration at rest, performed using the same low strain value from the LVE region as in the first test interval. For both test intervals using oscillation, the same (angular) frequency is preset.
(2) structural breakdown induced by high shearing with a decrease in viscosity (rotation), (3) at rest again during structural regeneration showing the crossover point G' = G'' and finally, in a solid state again, with G' > G'' (oscillation). This example shows complete regeneration of the structure.
The results of the measurement are presented as time-dependent functions of the storage modulus G', loss modulus G'', and shear viscosity η (Figure 7):
- Behavior nearly at rest,
- Behavior during structural breakdown under high shear conditions,
- Behavior during structural recovery nearly at rest.
The diagram shows a solid structure in the first test interval (with G' > G''), a liquid structure in the second interval, and finally a solid structure again after exceeding the crossover point G' = G''.
Time-dependent behavior with gel formation or curing
This oscillatory test is performed under constant dynamic-mechanical conditions. Accordingly, both parameters – shear-strain (or shear-stress) amplitude and (angular) frequency – are kept constant in this test. In most cases, controlled-strain tests are preferred. One disadvantage of controlled-shear-stress tests is that, with increasing values of G' and G'', the resulting deflection angle will decrease continuously. This would result in the degree of deformation no longer being constant. However, the latter is a decisive parameter for comparing the effects that shearing has on the behavior of a sample.
Furthermore, the measuring temperature is kept constant thus providing for isothermal conditions. It is recommended that disposable measuring systems are used, consisting of a disposable plate and a disposable dish for single use.
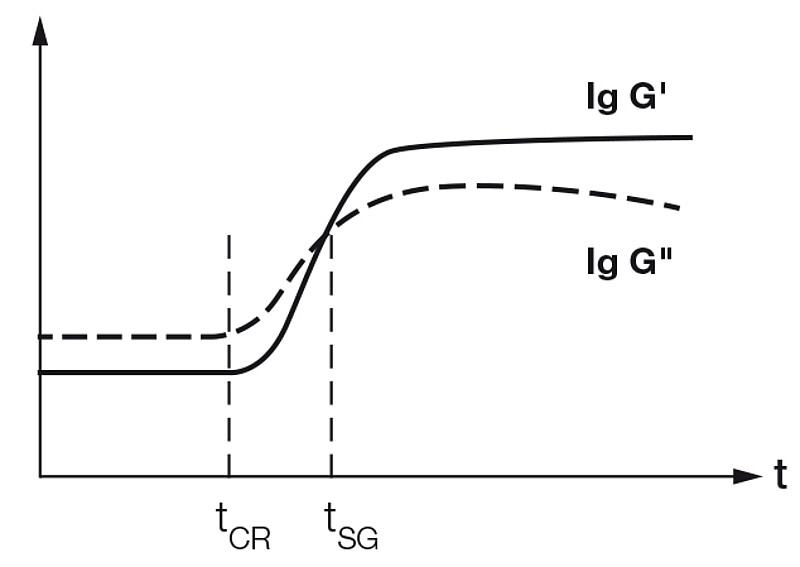
The result is usually evaluated as time-dependent functions of G' and G'' (Figure 8). There are two time-points that are of special interest: The time-point tCR where the curve of the G' function starts to rise at the beginning of a gel-formation or chemical curing process, as well as the time-point tSG at the crossover point G' = G'' as the sol/gel transition point, often also just called the gel point. In addition, the final values of G' and G'' are evaluated in many cases.
Conclusion
For evaluating time-dependent viscoelastic behavior, oscillatory tests are performed with shearing under constant dynamic-mechanical conditions. This means: Both amplitude and frequency are kept constant for each individual test interval.