Particle size in food industry
Many food items are present in particulate form at one time or another during their production process, such as powders, suspensions, or emulsions.
For powders, particle size affects bulk density and, thus, powder flow properties. Likewise, in suspensions, particle size strongly influences shear viscosity. This in turn critically affects pumping, mixing, and transportation of the raw materials.
Storage and stability of food products are highly influenced by their particle size. While powdered food items can undergo caking, emulsions (e.g. milk) can have stability issues if the droplet size increases or is not thoroughly controlled.
Texture and mouthfeel play pivotal roles in the acceptability of food products. Their organoleptic properties are highly influenced by the particle size. As the human tongue is capable of detecting particles of just a few microns in size, tweaking the size of particles can have a big impact on product acceptance.
In order to determine the sizes of small particles such as coloring and flavoring components, Litesizer DLS would be the instrument of choice (0.3 nm to 12 µm) using dynamic light-scattering technology. Larger sizes can be analyzed with the laser diffraction instrument Litesizer DIF (10 nm to 3.5 mm). The Litesizer DIA Series allows for the measurement of particle size and shape within a range of 0.5 µm to 16,000 µm.
The perfect coffee taste
A huge variety of coffee beans and blends, as well as different roasting techniques and degrees, influence the taste of coffee. In addition, the particle size of coffee is crucial and needs to be optimized for each coffee and brewing method in order to generate the pleasure of a perfect coffee flavor and taste. Espresso requires a very fine coffee powder whereas filter brewing or French press preparations use bigger particle sizes.
For reproducible high-quality of grinded coffee, particle size needs to be controlled regularly after grinding.
Litesizer DIF uses laser diffraction technology to determine particle sizes between 10 nm and 3.5 mm and covers the optimal range of coffee powder. Fast and easy measurements of the dry powder ensure reproducible high product quality and the perfect taste of coffee.
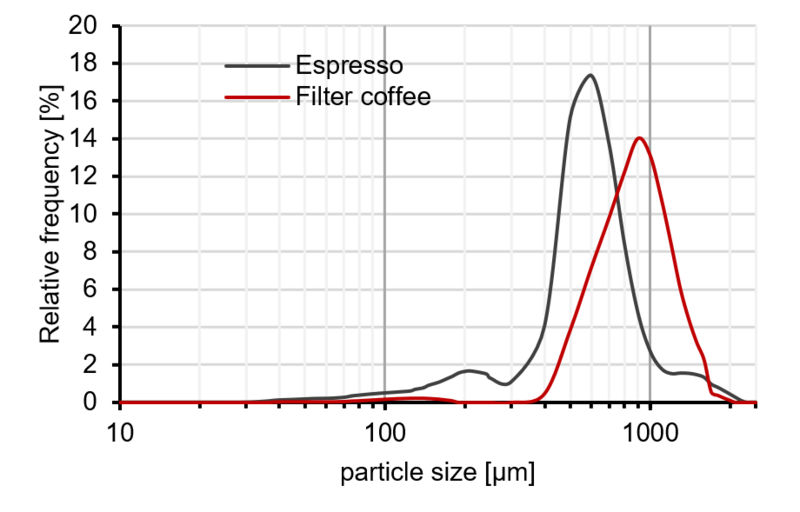
The graph compares the particle size distribution of an espresso powder with the one for filter coffee. The main fraction for espresso is below 1 mm with a peak at 600 µm. In contrast, particle sizes for coffee powder used for filter coffee or coffee crema are much higher. Here the peak is at 900 µm with a significant fraction above 1 mm.
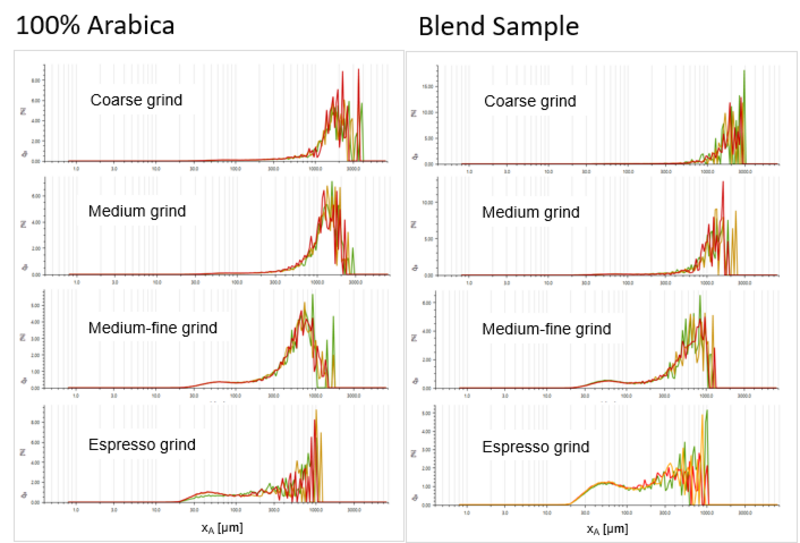
Litesizer DIA is capable of conducting particle size and shape analysis on both whole and ground coffee samples. A comparative analysis between a 100 % Arabica sample and a blended sample consisting of 80 % Arabica and 20 % Robusta indicates that pure Arabica is more prone to breakage and contains a higher proportion of fine particles than the blend.
Additionally, when ground using a burr grinder set to the fine (espresso) setting, Arabica particles achieve a finer median size, further supporting the sample’s increased brittleness.
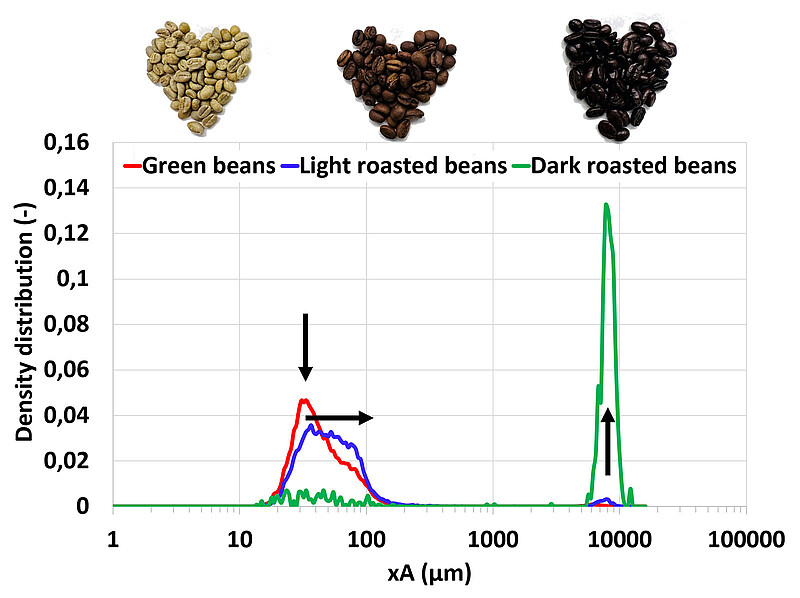
Understanding the particle size distribution of coffee beans before and after roasting is essential for managing the quantity of fine particles prior to grinding. Lighter roasts lead to a modest reduction in fine particulates due to the evaporation of volatile components.
In contrast, darker roasts result in a more pronounced decrease in fines, indicating that higher roasting temperatures and longer durations contribute to a reduction in volatile fine particles.
Milk and milk powders
For milk, creaming is a shelf life-limiting factor. Creaming amount and visual appearance are influenced by fat globule size, storage time, and temperature or package size and shape, as well as milk quality. The particle size of milk fat globules usually ranges from 0.1 µm to 15 µm to 20 µm with an average size of 3 µm to 4 µm (Pak, 2019). Low-density fat globules float to the surface in a process called creaming. Shelf life is prolonged by homogenization which leads to a unified, reduced homogenized milk fat globule size. Here, homogenization efficiency can be evaluated via D[5,3] and D90 values.
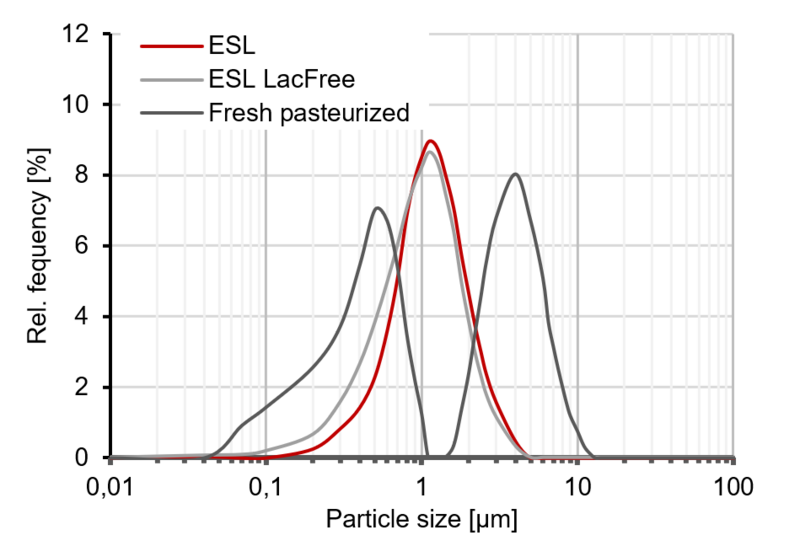
The graph compares the particle size distributions of homogenized elongated shelf-life milk (ESL) with fresh pasteurized milk. They were determined by laser diffraction using the Litesizer DIF liquid mode. For ELS milk a monomodal particle size distribution is shown with a peak size around 1 µm representing the fat globule size in homogenized milk. In contrast, for fresh milk, two peaks are present with a fat globule fraction between 2 µm and 10 µm. These differences in milk particle size are represented by the D[5,3] and D90 values.
Milk powder should dissolve quickly and have good flowability, and particles should not stick together. Milk powder particle size determination enables quality control via the use of the Litesizer DIF Dry dispersion unit.
- Milk Powder Characterization - Dissolution of Infant Formula and the Final Milk Product
- Milk Powder Characterization – Chapter 2: Packaging, Transport, and Storage
1. Tetra Pak. Optimized homogenization of milk technology, measurement, and processing strategies. s.l. : Tetra Pak International S.A., 2019
Flour
Finding the best-suited flour is not easy. Flour is available based on different cereals and in a huge variety of grinding degrees optimized for specific applications: baking a cake, bread, or biscuits. Flour grain size not only influences mouth-feel and the appearance of the final product but also batter or dough properties such as density and viscosity and the final product volume, as well as quality or softness.
Particle size determination assists quality control but also optimizes the manufacturing process regarding temperature and humidity. Detecting the % of very fine particles helps to judge the risk of dust explosions during manufacturing.
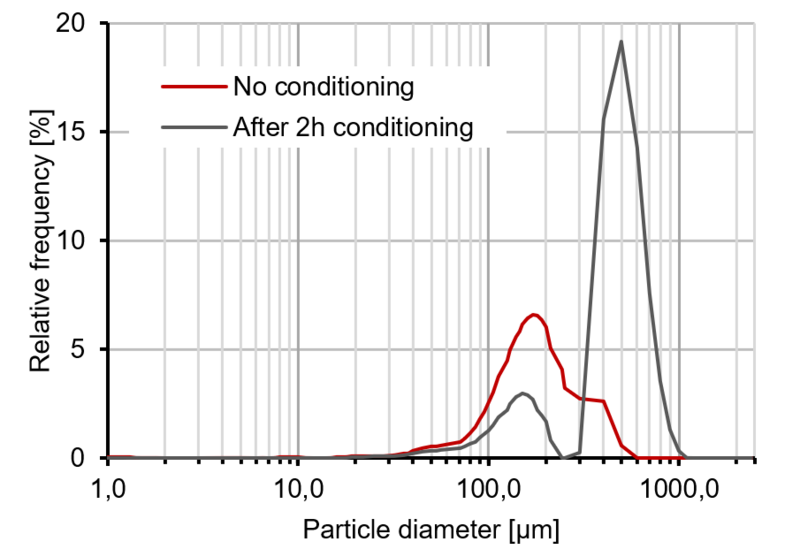
The graph shows the particle size distribution of unconditioned flour with a size range of 80 µm to 500 µm and the influence of 35 °C, 95 % humidity (conditioning). Particle size dramatically increases with increasing humidity due to swelling and aggregating particles in the range of 200 µm to 900 µm.
Chocolate
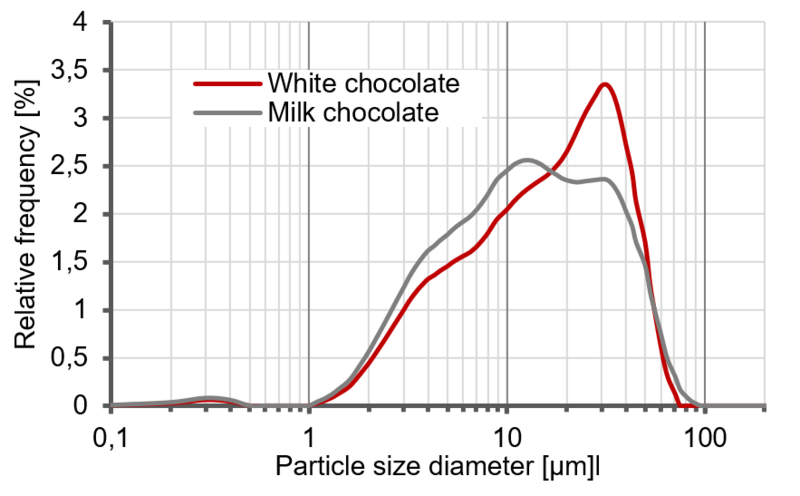
Chocolate is associated with a soft, smooth, and creamy mouthfeel and a typical flavor. Creating such a distinct mouthfeel requires a defined texture and melting characteristic of each chocolate. The particle sizes of the ingredients as well as the fat and lecithin content significantly influence these characteristics but also properties such as yield stress, viscosity, firmness, hardness, and the melting index. For this reason, regular chocolate particle size determination during the manufacturing process not only ensures constant high quality of the intermediate and final products but also enables optimization of the process itself as well as the final product.
Due to a typical chocolate particle size range between 1 µm and 80 µm, laser diffraction instruments such as Litesizer DIF are optimal instruments either in a laboratory setting or at the production line to measure the particle size at different stages in the manufacturing process. The graph shows a typical particle size distribution of white and milk chocolate analyzed in a defined triglyceride solvent. White chocolate contains a higher number of large particles due to the higher sugar content and the missing cocoa.
Sugar
The most commonly used form of sugar in the kitchen is sucrose. Liquid plant extracts are refined and crystallized with the resulting product termed granulated sugar. The grain size of sugar in mm defines its application field, so intense quality control is indispensable. Coarse sugar crystals up to 2.2 mm are excellent on patisserie products such as cookies, cakes, and sweetbreads. For biscuit mouth-feel, a medium size of 600 µm to 800 µm would be the right choice. Caster sugar particle size between 150 µm and 450 µm is used for bakery applications such as smooth doughs and produced by pulverizing granulated sugar. By milling granulated sugar, a powdered sugar particle size or icing sugar particle size of around 50 µm is reached, the finest commercially available grain size of sugar. Since sugar dissolves rapidly in water, particle size determinations by laser diffraction in dry mode would allow fast, easy quality control of sugar grain size.
Flavored emulsions
Food flavor is of utmost importance for food quality, on which consumers never want to compromise. Flavor emulsions can be used as food excipients to improve the taste of many food products. They typically contain water, essential oils, and emulsifiers. The stability of these raw materials has to be ensured in order to prevent degradation during processing and to increase the shelf-life of the final product.
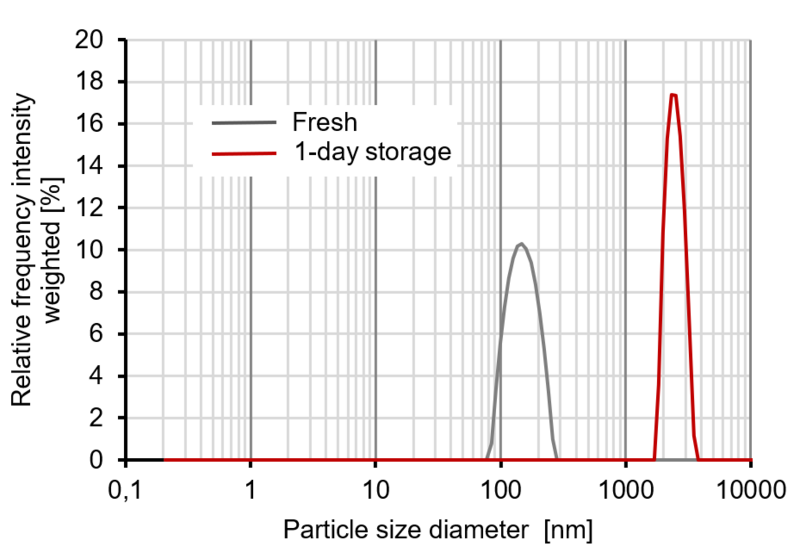
We measured a flavor emulsion by using Litesizer DLS after production (Fresh) and after one day of storage at room temperature.
After one day, particle size had increased significantly from 155 nm to 2587 nm, indicating that the flocculation process had started. Therefore, the mixture had become more turbid and the measured transmittance had decreased.
Infused beverages

Plant extracts or other health-promoting substances such as vitamins are popular supplements in a variety of food and beverage products and are generating significant interest in the health and wellness industries. Since a majority of them contain hydrophobic components, emulsifiers are used to create stable ‘oil-in-water’ emulsions in order to overcome the mixing limitations. This method not only increases solubility but also the bioavailability of the hydrophobic components. In this regard, particle size is critical for body absorption and bioavailability in general but also storage and transport stability of the beverage. Control of droplet size via dynamic light scattering enables optimized beverage formulations, bioavailability, and storage conditions. The graph compares two infused beverages using different emulsifiers. The acacia gum-containing beverage shows a lower droplet size indicating increased stability and body absorption compared to the xanthan gum-containing beverage.