Quantum physics at work: Infrared spectroscopy
We experience quantum physics in many everyday situations, usually without even knowing it. Without it there would be no internet, no computers, no magnetic resonance images of our bodies, no modern medicines. Infrared spectroscopy, a frequently applied method for chemical analysis, shows the peculiarities of quantum physics in a particularly impressive way.
How does infrared spectroscopy work? A sample is irradiated with a wide-band infrared light in the wavelength range of 2.5 to 25 µm. The light passes through the sample or, alternatively, is reflected from the sample. This light is then split into its spectral components. Information about the sample can be gained from this spectrum. To understand which information can be gained from this spectrum we will look at a simple and very common molecule: carbon dioxide (CO2).
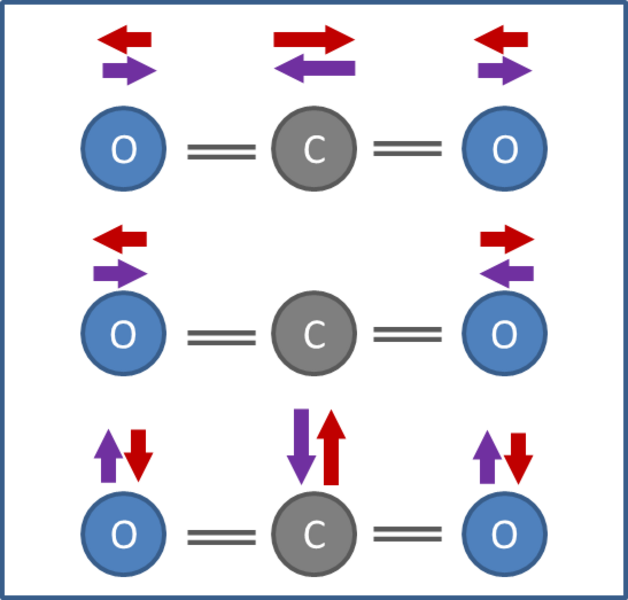
Molecules are mechanically vibrating entities. They can vibrate in various ways, as shown in Figure 1 for the CO2 molecule. First we will look at the molecular vibration shown in the top line of Figure 1. This is called the asymmetric stretching vibration. The resonance frequency of this vibration is at 70.4 terahertz, the corresponding wavelength therefore being 4.26 µm. The positive center of charge of the molecule, which is generated by the charge of the atomic nuclei, and the negative center of charge, which comes from the electrons, move periodically towards and away from each other during this vibration. This creates a vibrating electrical dipole – a sort of “antenna” – which is why this vibration is infrared active. The molecule can take up an infrared photon of this wavelength from an electromagnetic radiation field and thus moves from the ground state to the excited state – or it can radiate off an infrared photon to move from the excited state back to the ground state. Due to the laws of quantum physics the vibration states are quantized, as will be shown in more detail later using the example of the rotational levels.
Determining the concentration
The number of infrared photons of this wavelength which are taken up by the CO2 molecules from the infrared light is indicative of the number and concentration of the molecules in the sample. In practice it is not the number of photons which is determined but the intensity ratio of the light which passes through the sample to that which is shone onto the sample. A corresponding measure is the absorption coefficient, which is the negative decimal logarithm of this intensity ratio for 1 cm of sample. In spectroscopic work it is common to use the wave number per centimeter instead of the wavelength. This is provided by the simple formula 0.01/wavelength.
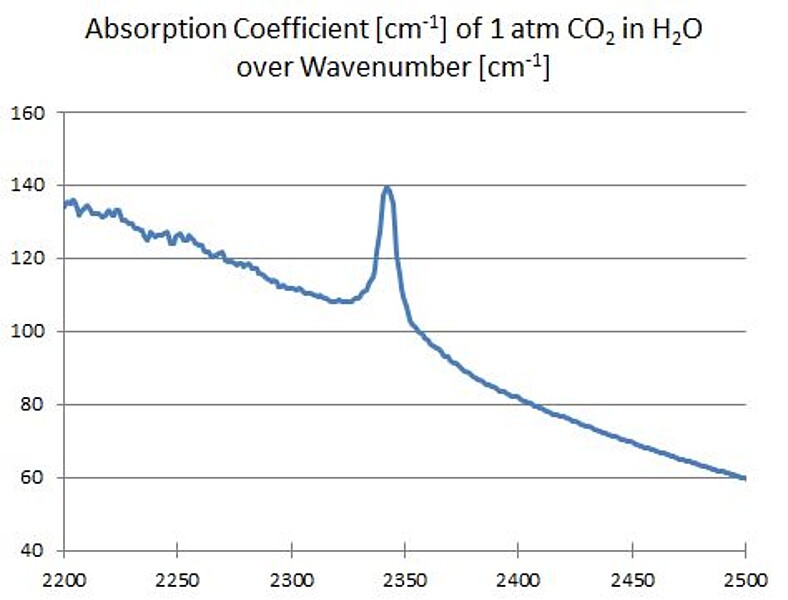
Figure 2 shows part of the measured spectrum of a water sample containing dissolved carbon dioxide. The drop in the spectrum from left to right is caused by the water. The peak of the asymmetric stretching vibration should be at 2349 cm-1. At this wave number the CO2 molecules should absorb the photons of the irradiated light and either radiate them off in a different direction or convert them into heat. However, in Figure 2 the maximum of the CO2 peak is actually at lower wave numbers than expected. The main reason for this is the influence of the surrounding water on the dissolved CO2 molecules. At any rate, the CO2 concentration in the sample can be calculated from the area or height of the CO2 peak shown.
Measuring in the gas phase
As we have seen that the surrounding water has an influence on the spectrum of the dissolved CO2 we now want to observe the infrared spectrum of pure CO2 in gaseous form. Here we should see a sharp peak at 2349 cm-1. However, there is a surprise: At exactly 2349 cm-1 there is no peak at all, but to the left and right of this point we see a whole collection of peaks with a characteristic height distribution (Figure 3).
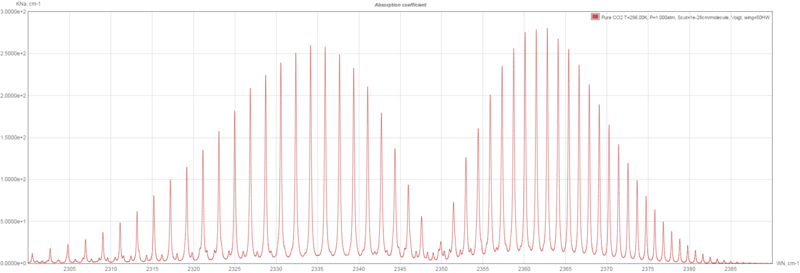
The reason for this shape of the spectrum is that gaseous CO2 molecules not only vibrate, they also rotate. However, the molecules cannot rotate at any given rotational speed. Due to quantum physical laws only discrete rotational levels occur and these create the discrete spectral lines. The absorption of a photon induces the asymmetric stretching vibration and also brings the molecule onto the next higher or lower rotational level. This happens because the photon also transfers a quantum of angular momentum. From the position and intervals of these peaks it is possible to determine the characteristics of the molecule, which we assumed to be known here. The height distribution of the peaks is a result of the Boltzmann distribution of rotational energies and therefore depends on temperature.
And what about the two other vibrational modes shown in Figure 1? The middle line depicts the symmetric stretching vibration. This is characterized by the fact that the positive and negative centers of charge do not move against each other because the vibration is symmetric to the center of the molecule. So no vibrating dipole occurs, no infrared energy can be absorbed or radiated off and therefore this vibration is not visible in the infrared spectrum. On the other hand, this vibration is Raman active – but that is a story for another day.
The vibration shown at the bottom of Figure 1 is a deformation vibration with two-fold degeneration. Degeneration means that several vibrations with the same frequency occur, here both in the and out of the image plane. This vibration is infrared active and shows a distribution of the peaks similar to that shown in Figure 3. However, in contrast to Figure 3 there is a very strong peak at the fundamental resonance of 667 cm-1. The reason for this peak to be present is that the vibrating dipole occurs in normal direction to the main axis of the molecule. Then the transfer of vibrational energy is also possible without a change of the rotational level.
Summary
Infrared spectroscopy is a frequently used method in chemical analysis. Its functioning is based on the laws of quantum physics and these are clearly expressed in the spectra. On the subject of determining the concentration of carbon dioxide in aqueous solutions it should be mentioned that there are other highly specific measuring options available for this task, including the measuring instruments for dissolved gases CarboQC from Anton Paar.
Many thanks to Dr. Roman Benes at Anton Paar for his contributions to this blog post.