Turbidity analysis
Per definition, turbidity is the decrease in the transparency of a liquid caused by the presence of undissolved substances. The main focus in turbidity analysis is therefore to monitor the clarity of a liquid, and assess its visual appearance.
General aspects
Turbidity analysis provides information about the performance of filtration processes but is also used to ensure product quality in a variety of industries.
Turbidity, also called haze, is not a well-defined physical entity like temperature or the density of a liquid, but is always expressed with reference to a well-defined standard. Haze has nothing to do with color. The juice shown on the left side in the photograph is turbid, the juice on the right is clear, but both are yellow: the color is the same, the turbidity is different.
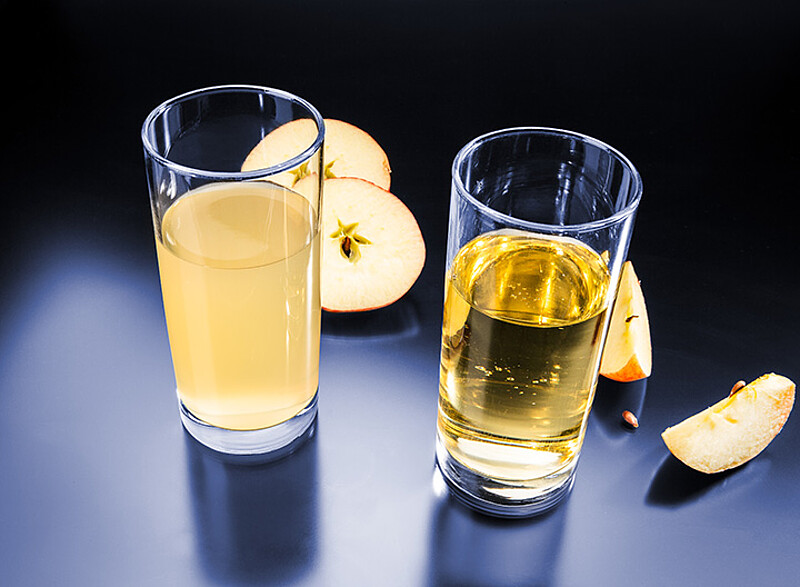
Examples of different turbidities
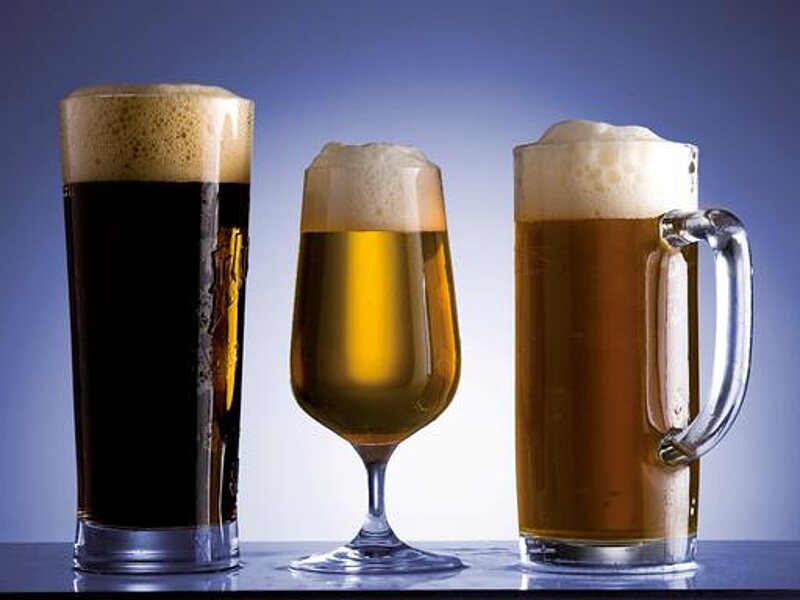
Turbidity and color share the same unit in the brewing industry (EBC) but their meanings are still different.The picture to the right highlights the difference between beer color, beer with low turbidity, and beer with high turbidity.
From left to right:
- dark, but clear beer with a turbidity of about 6 EBC
- bright lager beer with a turbidity of about 5 EBC
- turbid wheat beer with a turbidity of about 60 EBC
Historical and state-of-the-art methods
In the old days a simple turbidity measurement was carried out by putting a scale with letters of different sizes behind a sample cuvette.The smallest letter that could still be read was a measure of the turbidity of the sample.
There is no need to mention that this test was not extremely accurate as it was liable to the operator’s subjective impression.
Today, analytical instruments determine turbidity accurately and repeatably. State-of-the-art turbidity meters measure the scattering of light at three angles from which the turbidity is derived.

Wavelength, measuring temperature, and evaluation of signals
Turbidity measurement is an optical analysis method, which detects the intensity of scattered light emitted by a light source. The intensity of scattered light is detected by photodetectors positioned at specific angles around the measuring cell.
The turbidity result reported for a substance strongly depends on the method used to determine it. The methods for determination of turbidity in a liquid often differ due to the following parameters:
Wavelength of light source
The wavelength of the light, emitted by the incorporated light source, is a significant parameter which influences the reported turbidity. Which wavelength is used is specified by the standard the measurement needs to comply to. Whereas a light source emitting light at 650 nm is common for the analysis of beverages, other wavelengths are used depending on the application they serve.
Measuring temperature
Turbidity greatly depends on temperature. Generally speaking, turbidity increases with decreasing temperature. Depending on the sample and its ingredients this effect can change.
The analysis of spirits such as whisky is suitable as a practical example: At low temperatures, the fatty acids and their esters contained in spirits partially precipitate forming a haze as they are less soluble at lower temperatures. This unwanted occurrence is called “chill haze” and should be avoided as consumers prefer a chilled drink which is clear.
Due to this effect, turbidity analysis of samples at low temperatures is common.
Evaluation of signals
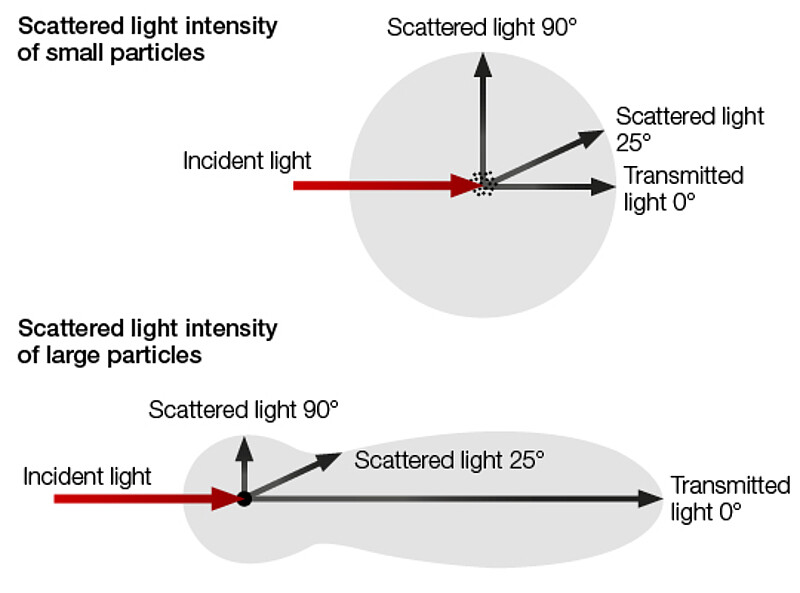
Light scattering which is measured to derive a turbidity value strongly depends on the size of the particles in the sample to be measured.
- Scattered light at 90° is used to detect the presence of small particles.
- 25° (forward scattering) is used to detect large particles.
- Transmission at 0° is used to compensate the sample’s color.
Data evaluation is often carried out with the proven and reliable Ratio Method which uses all evaluated angles as a basis for the calculation of the sample’s turbidity.
Using the analysis of all three of these angles in one measuring method enables turbidity determination which considers particles of any size, independent of the color of the sample.