Avoid Measurement Errors in Rheometry
Selecting the optimal measuring geometry
The first step is to decide which measuring geometry to use.
Cone/plate (CP) or cone-and-plate measuring geometries
Although CPs are suitable for most samples, they have one limiting factor: Because the shear gap at the center of the cone is usually very narrow, the rule of thumb regarding maximum particle size, as mentioned above by Joe Flow, is particularly important with this kind of geometry systems.
Concentric-cylinder (CC) measuring geometries
CC geometries are recommended for low-viscosity liquids and liquids with low surface tension (such as oils) because they often tend to flow out of the gap of CP or PP geometries. You should also measure samples that dry quickly with a CC geometry because the annular shear gap of a CC is covered from above by a thick layer of excess sample.
Plate/plate or parallel plates (PP) measuring geometries
PP geometries are well suited for samples that contain comparably larger particles because the typical PP gap width of 0.5 to 1.0 mm is rather large. Highly viscous samples, such as unfilled polymer melts, are mostly tested with a PP geometry. In a CP geometry, the samples are subjected to much more shearing (stress and strain) during gap setting because of the much smaller gap. Thus, in a CP geometry, polymer samples would need a significantly longer relaxation time prior to the actual measurement.
PP geometries are recommended for tests performed in a variable temperature range. Due to the larger measuring gap, there’s the advantage that the thermal expansion of measuring geometry and sample are less noticeable (than with CP).
Please note:
Make sure that you perform the zero-gap setting correctly when using CP or PP geometries. With modern rheometers, the control program will take care of this. If the measuring gap is too small, testing will be influenced to a higher degree by wall-slip effects, which results in measured values that are too low. If the gap is too large, only a part of the sample will be sheared, which also results in measured values that are too low (Figure 1). As a rule of thumb when testing dispersions, the measuring gap should be at least 10x larger than the maximum size of the particles or solid agglomerates in the sample. If you don’t observe this rule, your measured values may be too high.
Pretreatment and resting time for the sample prior to testing
The history of the sample is important and should always be taken into consideration. This applies to all mechanical, thermal, and temporal stresses that the sample has experienced prior to testing.
Please note:
Make sure that the sample is homogeneous (e.g., free of air bubbles). To achieve comparable values, you should prepare each sample with the same method. Storage conditions and stirring processes, for example, should be standardized. Although stirring or shaking should be avoided, if you have to do this, make sure it’s always performed the same way.
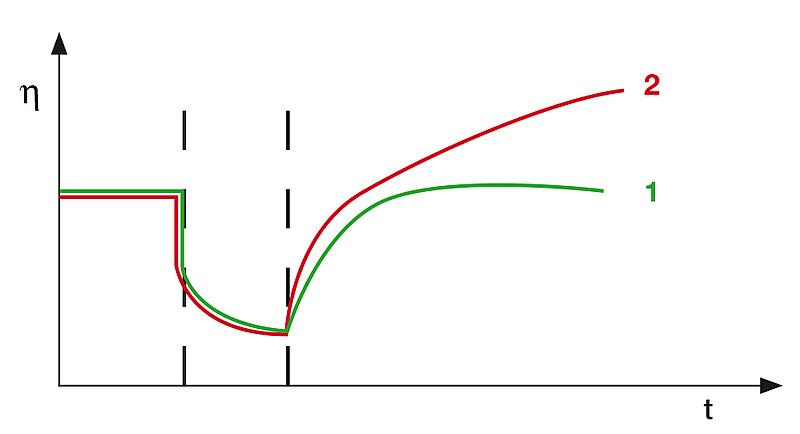
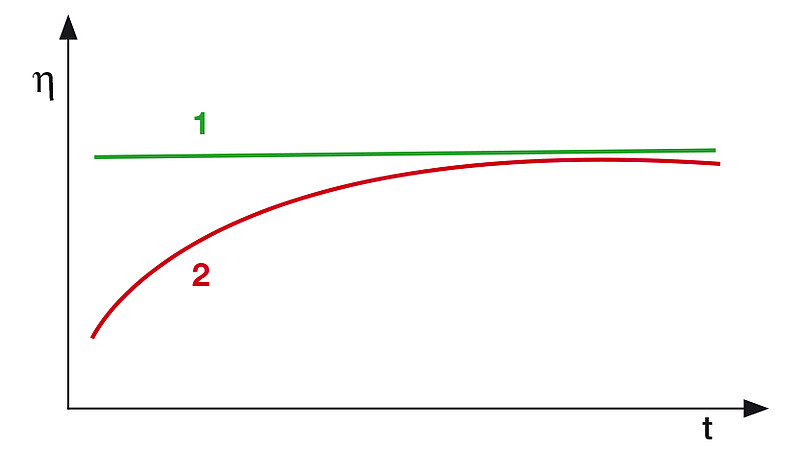
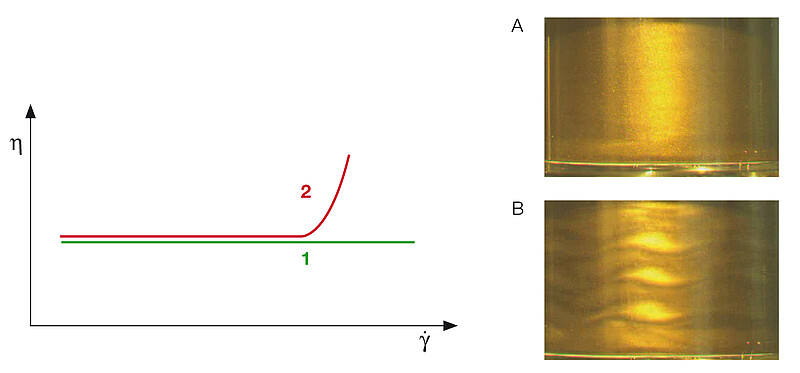
The procedures of putting the sample into the measuring system and setting the measuring gap already place stress on the sample. If the subsequent time-dependent regeneration of the sample’s inner structure takes a longer time, a corresponding recovery time must be incorporated prior to starting the measurement (thixotropic behavior). Too short a recovery time results in incorrect values. In Figure 2, for example, the viscosity measured for sample 2 is too low, and the curves show the shape of a growth curve because there are still start up effects.
Please note:
For samples that need a longer recovery time, a resting interval should be integrated into the test program prior to the first test interval (e.g., one to five minutes, if needed). Furthermore, with modern rheometers, you can reduce the stress on the sample because you can adjust the time required for gap setting accordingly.
Optimum sample quantity and trimming
When using a CP or PP geometry, if the sample quantity is too large, this results in measured values that are too high due to overfilling of the measuring gap and vice versa in the case of underfilling.
Torque range and size of the measuring geometries
The tests should take place within the optimum torque range. You should work in a range that’s greater than 10x the minimum torque but less than 90 % of the maximum torque of the instrument used. If a flow curve exceeds the constant maximum shear stress (or the maximum torque) of the measuring geometry used, the diagram will show a parallel line to the x-axis. In this case, you should use a measuring geometry with a smaller diameter (or a smaller shear area). If the measured values deviate strongly from the expected ranges of low shear rate (or rotational speed) or deformation (or deflection angle) and show marked outliers, then the resulting shear-stress values (or torque values) are often too low. In this case, you should use a measuring geometry with a larger diameter.
Please note:
By performing a short test prior to the actual test, you’ll find out whether you’ve selected the correct measuring geometry in terms of the upper and lower limiting-shear-stress values.
Shear waves in low-viscosity liquids
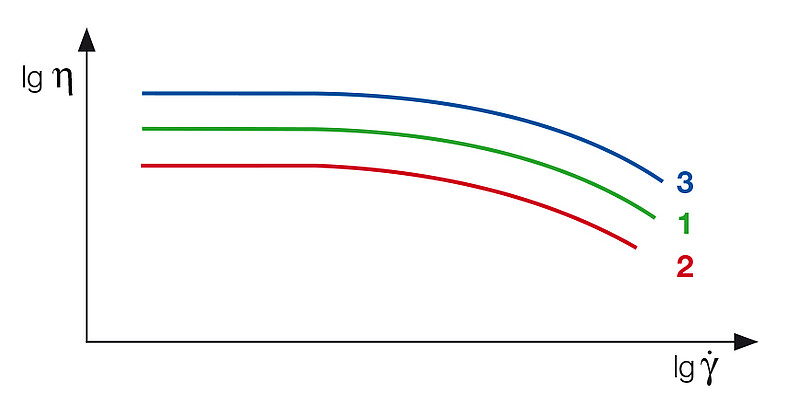
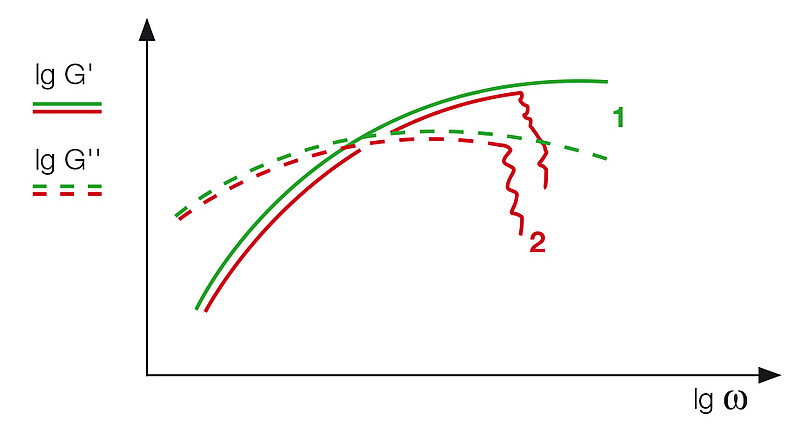
For oscillatory tests performed in the range of high frequencies, such as a frequency sweep, you can expect to see side effects that interfere in your results, particularly for low-viscosity liquids (with viscosities below 100 mPas, see Figure 3).
A rheometer always detects the sum of two torques. First, there’s the torque that’s required to move the entire driving system of the rheometer, including the measuring geometry (e.g., CP or PP) that’s being used. But you can compensate for this torque value and (almost) eliminate it through a combination of optimized instrument design and intelligent motor control during the measurement (e.g., an electronically commutated synchronous drive). For this, conduct a simple pretest, where the driving torque is determined with an empty measuring geometry (i.e., filled with air).
Second, there’s the torque value that’s measured as a result of the rheological behavior of the sample. Since this latter torque should be as large as possible relative to the driving torque of the rheometer (determined for the empty measuring geometry), using a measuring system with a shear area that’s as large as possible would be effective.
Furthermore, low-viscosity samples develop a fluid-specific inertia effect that can be observed as so-called shear waves in the shear gap at high frequencies. These waves arise because they’re not able to follow the rapid motion without delay. You can reduce this effect by reducing the sample quantity. If the measuring gap is very narrow, this effect becomes negligible.
Please note:
For frequency sweeps on low-viscosity liquids, select a CP or PP geometry with a diameter that’s as large as possible (e.g., 50 mm) and a measuring gap that’s as small as possible. For a PP geometry, for example, this would mean a plate distance of 0.5 mm or even just 0.3 mm. For a CP geometry, this would be a cone angle of 1° or 0.5°, or even just 0.3°.
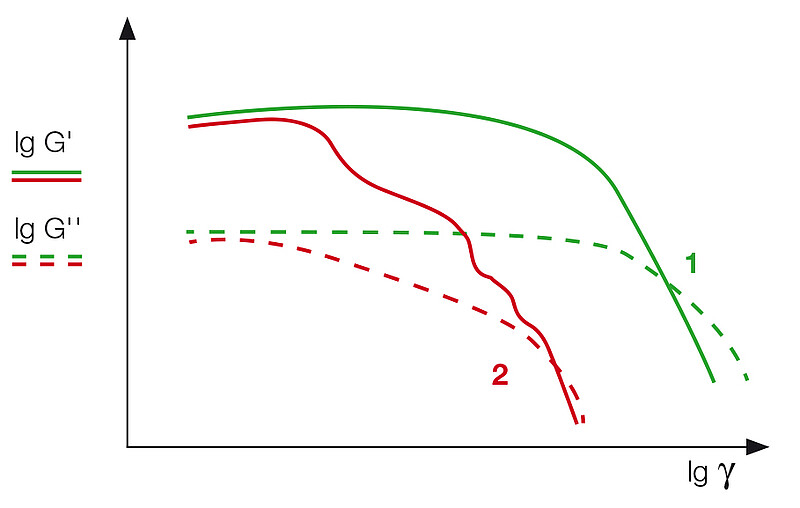
Wall-slip effects
For samples that contain oil or fat, be aware of wall-slip effects in the measuring geometry. In this case, the measured values will decrease earlier than usual and will continue to decrease. Often, sandblasted or profiled surfaces can prevent or at least delay this effect (Figure 4).
Please note:
For samples containing oil or fat, and for samples that are otherwise difficult to measure in terms of wall-slip effects, comparison tests conducted with regular smooth surfaces as well as with sandblasted and profiled surfaces will provide useful information on the occurrence and extent of this effect.
Sufficient temperature equilibration of sample and measuring system
The temperature is the most important influencing factor for all rheological values. Too short a temperature-equilibration time (heating or cooling phase) will deliver incorrect results because the temperature won’t be uniform throughout the entire sample. Too low a temperature increases the measured values and vice versa.
Please note:
Temperature-equilibration time prior to the measurement should be at least five minutes or even 10 minutes, depending on the measuring temperature.
When heating or cooling rates are too high, the sample temperature won’t comply with the target values. There will be a significant temperature difference at different locations in the measuring gap, producing a temperature gradient in the sample.
Measuring example:
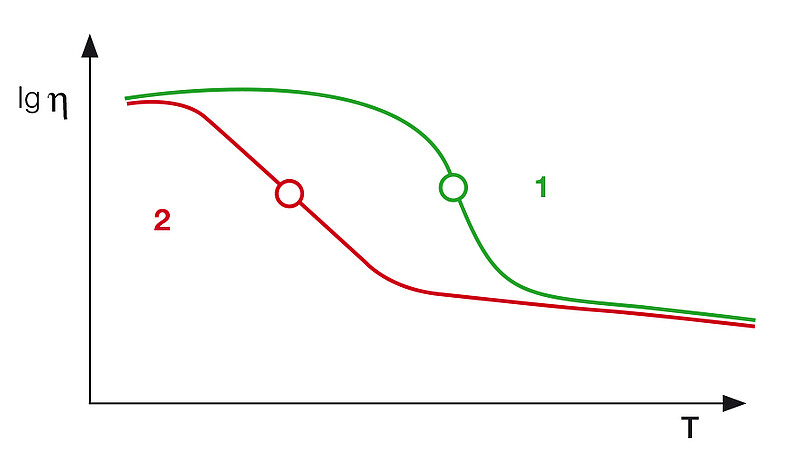
The heating or cooling rate has a strong influence on the determination of specific temperature values, such as the glass-transition temperature Tg of a polymer or the pour point of an oil (Figure 5). Heating and cooling rates should be in the g´range of 1 °C/min to 2 °C/min.
When conducting tests at temperatures that deviate by more than 10 °C from room temperature or tests performed in a range of variable temperature by heating or cooling (temperature sweeps), use an “active” temperature control hood. With such equipment, you can reduce the temperature gradient to a negligible minimum.
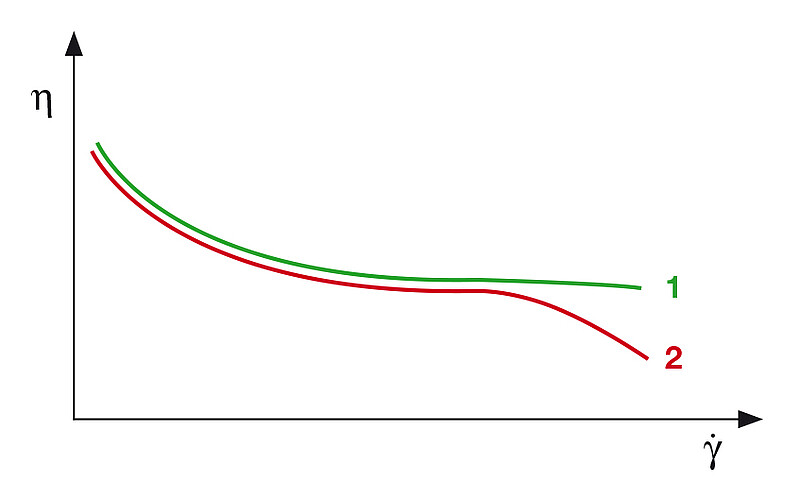
Viscous-shear heating at very high shear rates
At very high shear rates (>1000 s-1), maintaining a constant measuring temperature can be a challenge because the sample is also heated by the internal friction that develops during the flow process. In this case, the increase in the measured values would be slower than usual (in the case of shear stress), or they would decrease continuously (in the case of viscosity, Figure 6).
Please remember:
Every flowing liquid has a flow resistance that’s produced by the internal friction of the molecules and, if present, also by other components of the liquid. This is called viscous-shear heating.
Please note:
At high shear rates, you should preset a measuring duration that’s as short as possible (e.g., by selecting a small number of measuring point and a measuring-point duration of just one second).
Edge failure
When using a CP or PP geometry, keep edge failure in mind. Always watch the edge of the gap closely. You can use a video camera to record optical data like images or videos.
a) Centrifugal force
When using a CP or PP geometry at high shear rates, inertia effects can cause the sample to flow out of the gap or even to be ejected, which results in continuously decreasing measured values (Figure 7).
Please note:
For samples that tend to run out of the gap, select a measuring duration that’s as short as possible.
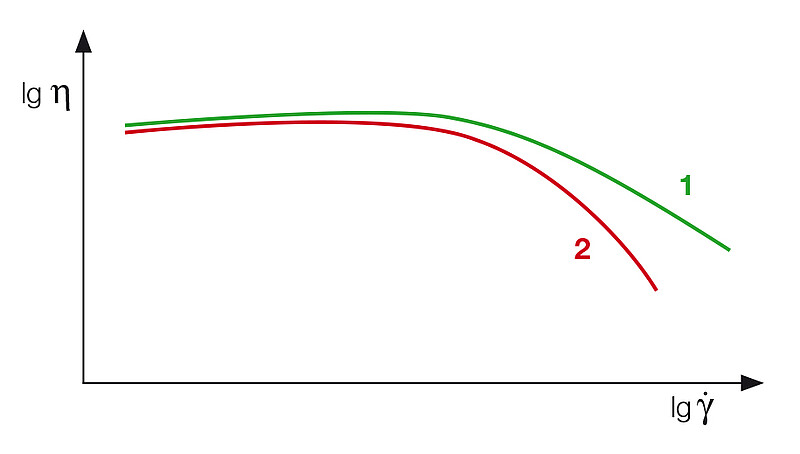
b) Streak formation, shear fracture, and melt fracture
At very high shear rates in CP and PP geometries, highly viscous and viscoelastic samples such as pastes and polymer melts may develop streaks and edge effects, including shear fracture and melt fracture (Figure 7). This often results in the sample breaking transversally and parallel to the bottom plate so that only part of the sample is still sheared. The sample no longer flows homogeneously, and you can expect sample to be discharged from the gap and air bubbles to appear. As a consequence, the measured values often fluctuate significantly, most commonly with a tendency to continuously decrease.
Please note:
For samples that show edge effects, select a measuring duration that’s as short as possible.
Turbulent flow
At high shear rates, low-viscosity liquids (viscosity <100 mPas) can develop turbulent flow with so-called secondary flow effects, such as vortex formation. In this case, the measured values will be significantly increased (Figure 8). If this happens, the requirement for laminar flow is no longer met, and therefore the measured values obtained can no longer be considered absolute values.
Please note:
Use measuring systems with a narrow gap for low-viscosity liquids. Use a double-gap (DG) cylinder geometry, e.g., as the gap here is much narrower than in a standard cylinder geometry. Alternatively, you can use a CP system with a small cone angle (1°, 0.5°, or even just 0.3°).
Rod climbing (Weissenberg effect)
When conducting rotational tests with a CC geometry, viscoelastic liquids could climb up the stirrer shaft at increased rotational speed (or shear rate). Rheologists call this the Weissenberg effect (5). It may result in an increasing amount of sample material migrating out of the annular gap between the cup and the bob. This effect can produce decreased measured values. Such effects can also occur in CP and PP geometries, which leads to edge failure.
Start up effects and transient effects
Transient (time-dependent) effects can occur if the measuring-point duration is too short for tests made in the range of low shear rates (e.g., below 1 s-1). These effects are also called start up effects (producing growth curves) because the flow within the entire measuring gap has not yet completely adapted to the preset shear conditions. In this case, the calculated values will be too low. A transient viscosity maximum (or peak) often develops for a sample with shear-thinning behavior during the measurement.
Please note:
There’s a rule of thumb that should be followed for tests in the low shear range (γ· < 1 s-1):
The duration for each measuring point (tMP) should correspond at least to the reciprocal shear-rate value, which is tMP ≥ (1 / γ·). Instead, it’s better to select fewer measuring points for each shear rate decade and to provide a sufficient period of time for each individual measuring point.
Segregation of the sample
Physically unstable samples consisting of components with different densities may segregate due to gravitational force. This can be experienced as sedimentation (settling) of particles, flotation (creaming) of droplets, or syneresis (segregation of different phases). Such separation often develops as a long-term effect.
Alternatively, you can use measuring geometries in the form of stirrers. If using such a system, bear in mind that the measured values are no longer absolute values but relative values. This is because the measuring geometry no longer complies with the specifications for absolute measuring geometries and there’s no longer laminar flow but a turbulent flow.
Evaporation of solvents and drying out of the sample
For samples that contain water or another solvent that can evaporate, use a CC geometry because other measuring systems can lead to drying out of the sample. Since with CC geometries a certain excess sample is used when filling the cup, these effects influence the test result minimally, in particular when using an additional hood or solvent trap. Thus, use a solvent trap for CP and PP geometries. A suitable design with a liquid reservoir that can be filled with solvent or water ensures that the measuring space is sealed from the environment. In this case, the sample is surrounded by a more or less saturated atmosphere. If the sample dries out, the measured values will usually increase steadily over time (Figure 9).