Temperature-dependent behavior (oscillation)
Temperature-dependent behavior without chemical modification
Typical tests in this field are used for investigating the softening or melting behavior of samples when heated; or solidification, crystallization, or cold gelation when cooled. Such tests are performed under constant shear conditions. Hence, the parameters shear-strain (or shear-stress) amplitude as well as (angular) frequency are kept constant in this test. A defined temperature profile is preset, for example with a temperature gradient of 1 °C per minute.
Thermal behavior of polymers
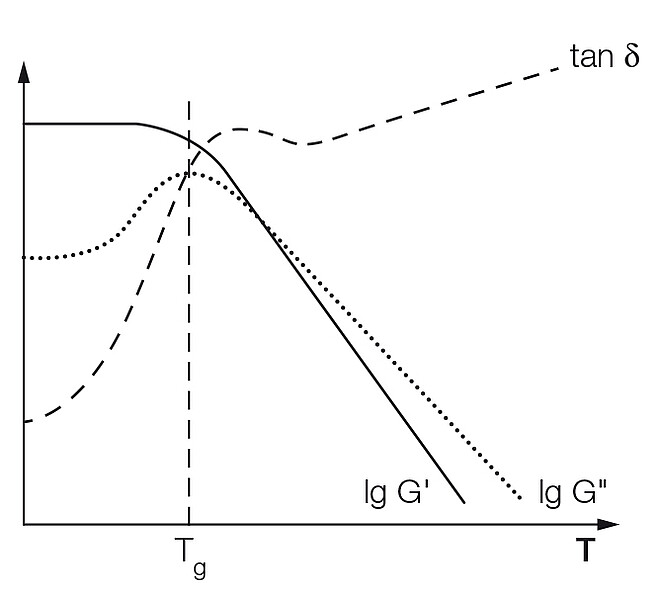
Temperature sweeps are often performed to characterize polymer structures and, in particular, to describe the internal superstructure and configuration of the macromolecules. The temperature-dependent functions of storage modulus G' and loss modulus G'' (and sometimes the loss factor tanδ = G''/ G' as a ratio of both moduli) are usually presented. The two most important parameters for the evaluation are:
Glass-transition temperature Tg, which is found approximately in the middle of the glass-transition range. When heating a cold and rigid polymer, the glass-transition range starts at the first signs of softening and ends when the molten state has been completely reached. The value of Tg depends significantly on the heating or cooling rate. Several evaluation methods are available that are described in various standards. For many users, the following is the method of choice and this is why it is recommended here: the temperature at G'' maximum is taken as Tg (see the standards ASTM D4065, D4092, E1640). Alternatively, the temperature at the maximum of the tanδ curve can be taken as Tg (as also stated in ASTM E1640). The latter method usually results in a higher Tg than that determined from the G'' maximum. Therefore, the analysis method used should always be stated in the test protocol.
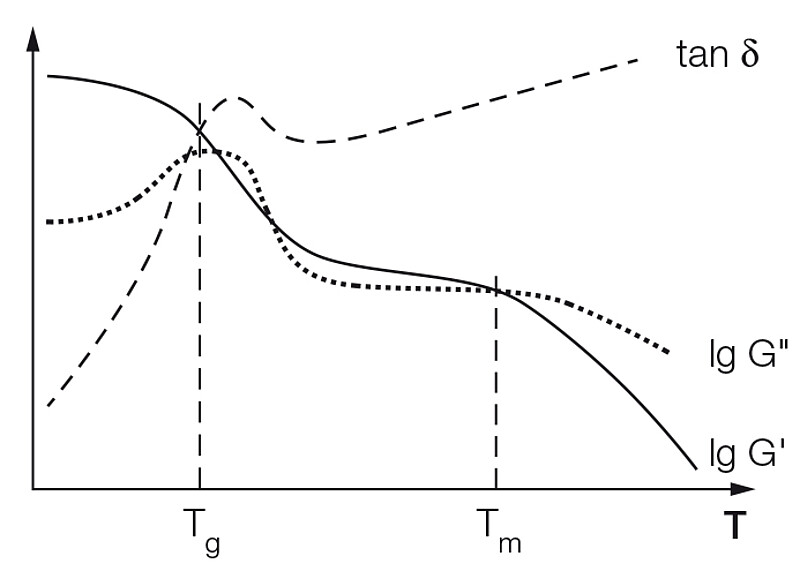
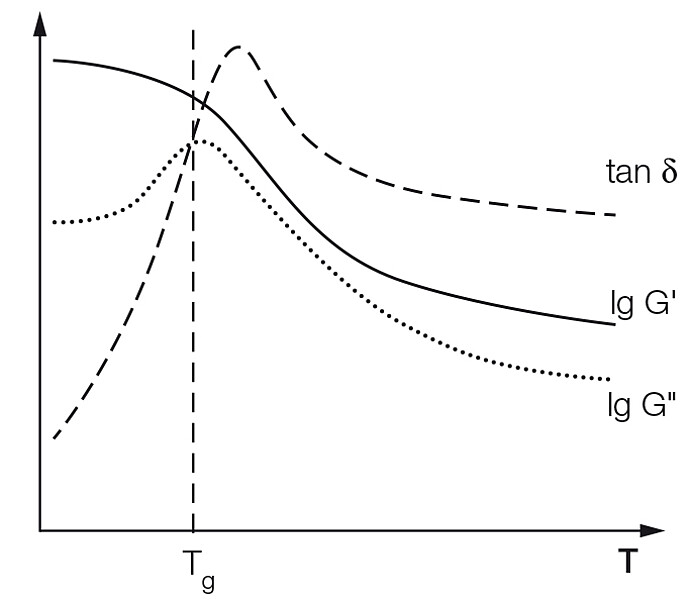
The melting temperature Tm, which is the temperature at the crossover point G' = G''. Materials scientists usually distinguish between three polymer groups based on the configuration of the macromolecules in the cold state; 1) amorphous polymers, 2) partially crystalline polymers, and 3) crosslinked polymers:
Thermal behavior of crystallizing solutions and dispersions
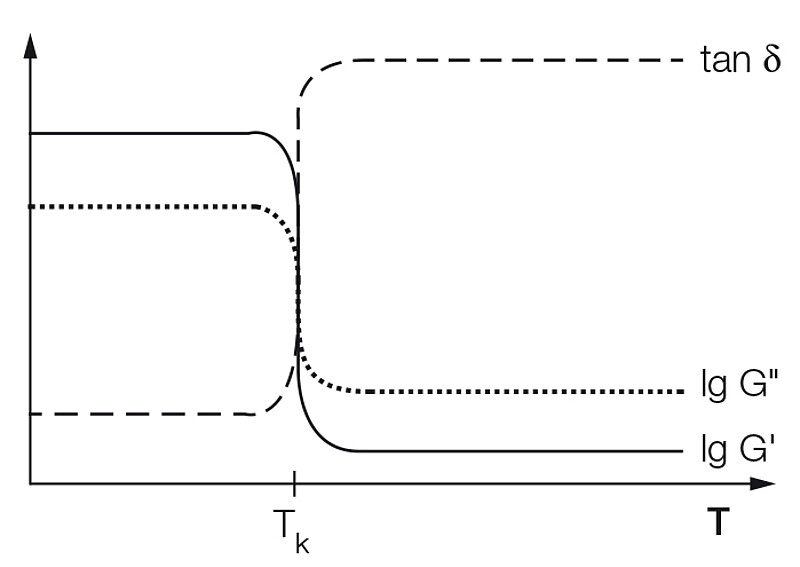
When crystallizing solutions and dispersions are heated and molten, or cooled down and solidified in the region of their crystallization temperature Tk, the curves of G' and G'' and that of tanδ show a sharp decrease or increase, respectively, within a very narrow temperature range (Figure 4).
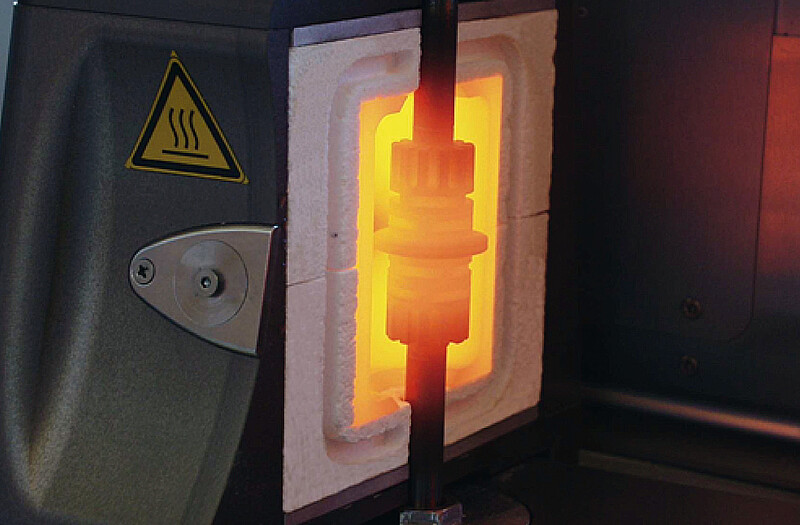
Tests performed at high temperatures
Specific measuring chambers are used for tests at high temperatures, for example in the range of T = 450 °C or 600 °C, or even up to 1,000 °C, or 1,600 °C (Figure 5). The aim of such a test is to characterize thermal behavior during a softening process or upon melting of samples such as glasses, metals (e.g. aluminum, magnesium, alloys), salts, slags (e.g. from iron-ore smelting in blast furnaces for steelmaking), or stone materials (e.g. basalt).
Temperature-dependent behavior with gel formation or curing
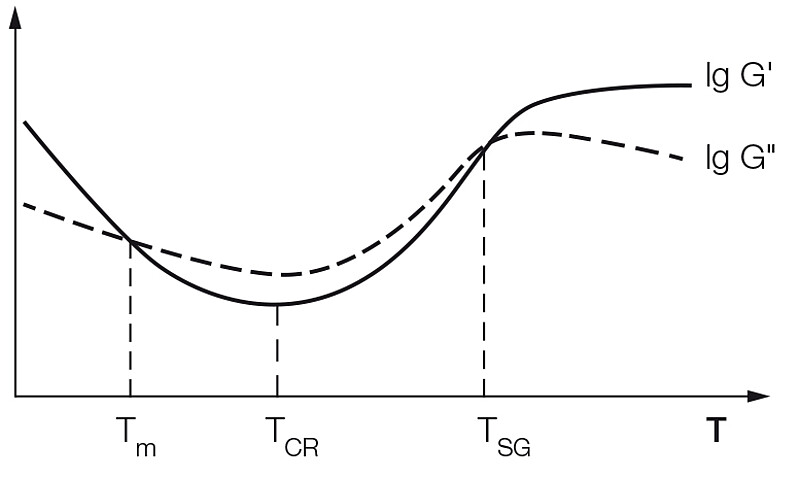
Typical tests in this field are aimed at investigating behavior during gel formation or chemical curing when a sample is heated. Constant shearing is preset which means that this oscillatory test is performed under constant dynamic-mechanical conditions. For this test, the shear-strain (or shear-stress) amplitude, as well as the (angular) frequency, are kept constant. In most cases, controlled-strain tests are preferred. One disadvantage of controlled-shear-stress tests is that, with increasing values of G' and G'', the extent of the resulting deformation of the sample will decrease continuously. In addition, a defined temperature profile is preset, usually with a temperature gradient of 1 °C per minute. For this type of test, it is recommended that disposable measuring systems are used, consisting of a disposable plate and a disposable dish for single use. As a result, the temperature-dependent functions of G' and G'' are evaluated (Figure 6). The following three temperatures are of special interest:
Melting temperature Tm at the crossover point G' = G''; beyond this point the sample is liquid.
Beginning of the gel formation or curing process at TCR, for example in the form of a chemical reaction. At G' or G'' minimum, the values of G' and G'' – as well as the temperature at this point – are important. If these values are too high, a sample may not flow and level as well as desired; if these values are too low, problems such as edge failure of a coating may occur (e.g. with powder coatings).
Sol/gel transition TSG at the second crossover point G' = G''; beyond this point the sample is solid.
Conclusion
Usually, the curves of G' und G'' are sufficient for evaluating the melting and curing behavior of a sample. The curve of tanδ is derived from these two functions and does not provide any new or independent information. This is also true for the curve of |η*|. In practice, using the complex viscosity for evaluation makes sense only as long as the sample is in a liquid state, for example for determining the viscosity minimum.