Temperature-dependent behavior without chemical modifications

Typical tests in this field are used for investigating the softening or melting behavior of samples when heated; or solidification, crystallization, or cold gelation when cooled (Figure 1).
Practical applications of this test include evaluating the pour point of crude oils, mineral oils, lubrication oils, and motor oils; examining bitumen as a binder in road construction, even under extreme weather conditions; testing food such as chocolate for determining the crystallization temperature of cocoa butter; or characterizing cosmetic products, e.g. emulsions, in terms of their behavior at temperatures that may occur in summer or winter inside a car. This test is carried out under constant shear conditions, either as a controlled-shear-rate test or controlled-shear-stress test.
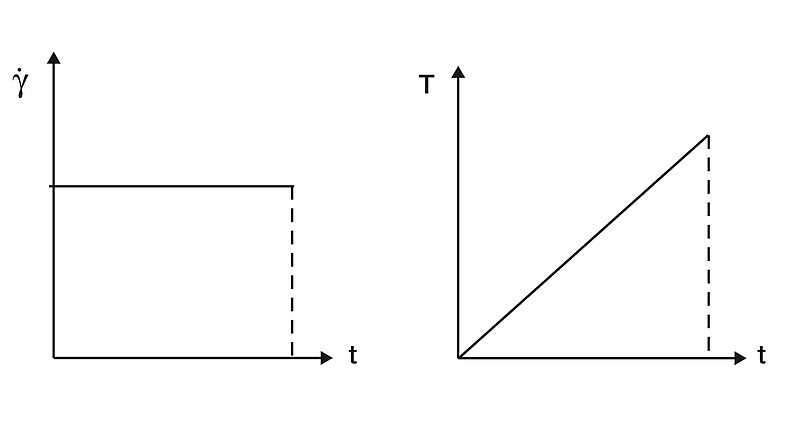
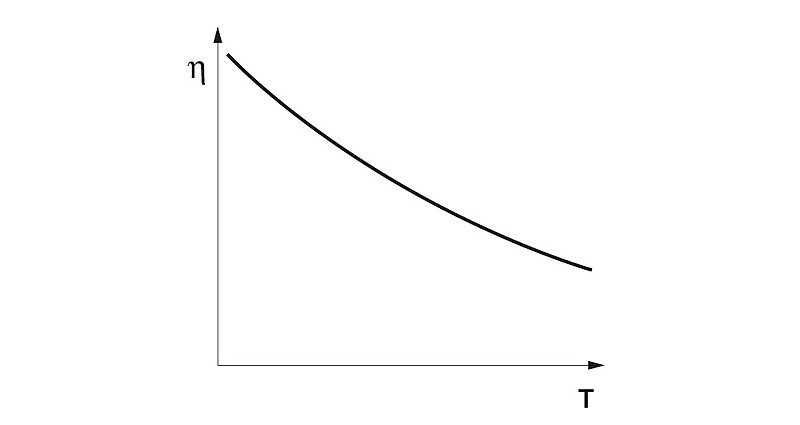
Mostly, controlled-shear-rate tests are preferred because here the sample is always subjected to a uniform deformation velocity independent of the viscosity. In addition, a defined temperature profile is preset, usually as a linear temperature increase over the duration of the measuring interval, for example using a time-dependent temperature gradient of 1 °C per minute (Figure 2). As a result, the function of temperature-dependent viscosity is usually evaluated (Figure 3).
Evaluation of the cloud point and pour point of a crude oil sample
A waxy crude oil sample was tested with cooling from T = +55 °C to +22 °C. The measuring program had two intervals:
1) Pre-shearing: 3 minutes at T = +55 °C at a constant shear rate of 50 s-1. This interval served for the simultaneous homogenization and temperature equilibration of the sample.
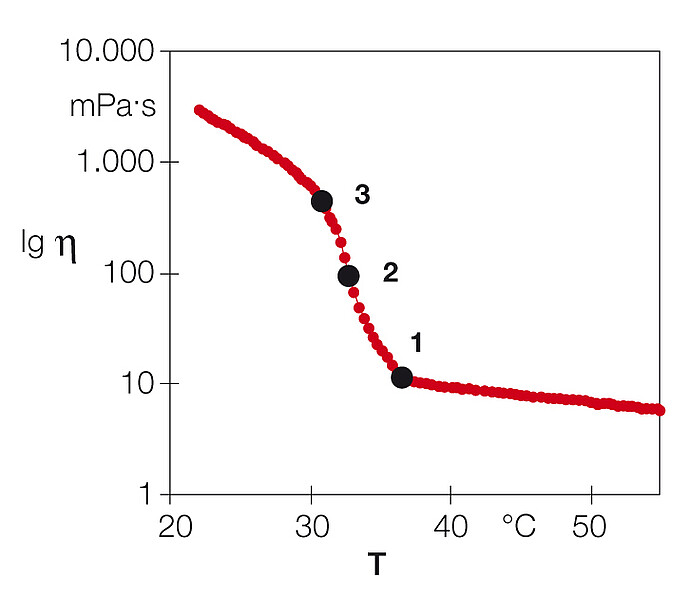
2) Measurement: Cooling from T = +55 °C to +22 °C with a temperature gradient of ΔT/Δt = 1 °C/min at a constant shear rate of 50 s-1 These two temperatures (cloud point and pour point) are very important in practice and they were determined by an appropriate software program. There are several methods available for evaluating cloud point and pour point. This means that the method applied must be known when discussing these temperature values. The evaluation method described below uses an analysis software that calculates the most important curve points (this is performed with the help of the so-called mathematical derivative of the viscosity function with respect to temperature). Usually, a semi-logarithmic diagram is used where viscosity η is plotted on a logarithmic scale versus temperature T on a linear scale, see Figure 4.
The cloud point
The cloud point (CP) characterizes the point at which an oil starts to turn cloudy. At this temperature, the first effects from the crystallization of waxes or paraffins become visible. CP is read at the bending point (1) where the slope of the viscosity curve increases; in this case it is at T = 36.5 °C, where viscosity η = 11.0 mPas. This point is calculated by the analysis software (as the local maximum of the first derivative of the viscosity function).
The pour point (evaluation method 1)
The pour point (PP) describes the viscosity immediately before the oil starts to solidify (thicken). If this happens, the solidification point has already been reached. This is the temperature at which crystallization of the oil has proceeded beyond which the oil will no longer be able to flow. PP is read at the inflection point (2) of the viscosity curve. In this case, it is at T = 32.8 °C, where viscosity η = 94.0 mPas. The inflection point is calculated by the analysis program (at the maximum of the second derivative of the viscosity function).
The pour point (evaluation method 2)
This is an alternative method for the determination of the pour point. Here the temperature at the bending point (3) of the curve is determined; this is the point where the viscosity curve tends to flatten after having passed the inflection point. In this case it is at T = 30.8 °C, where viscosity η = 426 mPas. This point is also calculated by the analysis software (similar to the first bend of the curve, as the local maximum of the first derivative of the viscosity function).
References
- Mezger, T.G.: Applied Rheology, 2017 (4th edition).