U-tube technology in digital laboratory density meters
Digital density meters are used in different industries and various applications. Although the basic setup and operations are the same for all laboratory instruments, there are differences regarding several basic elements that are not only due to the application requirements but also to the functionality of the instrument. The following article focuses on the basic elements of a digital density meter as well as on fundamental operations.
Instrument setup
The heart of a modern digital density meter is the measuring sensor (oscillator), usually a U-shaped tube that is electronically excited to oscillate at its characteristic frequency. The characteristic frequency changes depending on the density of the filled sample. Via a precise measurement of the characteristic frequency the true density of the sample is determined. Various oscillator types as well as evaluation methods are presented in the following chapters.
Oscillator type (sensor shape)
There are several types of oscillators (sensors) that are named according to their oscillation direction: Y oscillators, X-oscillators, and W-oscillators.
Y-oscillator
Common laboratory density meters make use of a Y-oscillator (“U-tube”). Its bend moves up and down. This setup is compact and allows for precise temperature regulation. The most sensitive part is the bend of the U-tube because the amplitude reaches its peak here. This type of oscillator is very sensitive and allows highly precise measurements. However, harmful vibrations must be eliminated by means of a countermass to which the U-tube is firmly fixed. This countermass has a flexible connection to the rest of the density meter and thus decouples the oscillation of the U-tube from any environmental vibrations.
X-oscillator
An X-oscillator is a U-tube with a fixed bend (in contrast to the Y-oscillator). The moving parts are therefore the straight tubes that move towards each other in opposite directions. These are the most sensitive parts of this type of U-tube.
The characteristic frequency of the X-oscillator is much higher and thus the viscosity influence (originating from the damping effect of the sample on the U-tube’s movement) is greater than for the other types.
However, the X-oscillator is not prone to mechanical vibrations and therefore does not require a countermass.
W-oscillator
A W-oscillator (also called double-Y-oscillator) is characterized by a total of three bends. The first and the last bend oscillate towards each other in opposite directions which makes them the most sensitive parts.
This type of oscillator can be used in instruments with limited precision, e.g. handheld instruments that neither have a countermass nor temperature regulation.
Sensor material
The sensor (oscillator, cell) can be made of glass, e.g. borosilicate glass 3.3, metals, or metal alloys, depending on the application and resistance to the sample and cleaning agents.[1] Two of the most common materials are described below.
Glass
Borosilicate glass 3.3 is the most common material for laboratory density meters. The most obvious advantage of a measuring cell made of glass is the possibility to see the sample and therefore check for the correctness of the filling process (i.e. the presence of bubbles or particles which would falsify the measured density). The chemical resistance of borosilicate glass is satisfactory for multiple applications; however, substances such as hydrofluoric acid (HF) and hydrogen sulfide (H2S) attack the glass sensor and therefore should not be filled in a glass cell.
Most precise laboratory instruments are equipped with an oscillator made of glass, due to the favorable temperature coefficient and sensitivity based on its low specific weight.
A measuring sensor made of glass is often enclosed in a glass housing (measuring cell) that protects the sensor from ambient influences and that is filled with a special gas to establish good thermal contact with a temperature regulation unit.
Metal (metal alloys)
Metal oscillators or oscillators made of metal alloys (e.g. Hastelloy) show high durability and fracture strength against mechanical stress. Metal cells or cells made of metal alloys can also be used if substances that attack glass, such as hydrofluoric acid (HF) or bases, have to be analyzed. A metal oscillator is characterized by its robustness, withstanding high pressures (up to 500 bar) and providing a wide temperature range (from -10 °C up to +200 °C). Cells made of metal or metal alloys can be used in handheld-, benchtop- or process density meters.
Countermass
A countermass is linked to the measuring sensor to reduce parasitic resonances (“external oscillations”) from other components, e.g. electronic parts. It is linked to the housing of the density meter by elastic supports and acts like a mechanical filter for external oscillations. The countermass has a resonance frequency that lies far below the frequencies used for density measurement. The countermass also ensures that the nodal points of the tube are constantly in position. The sample volume is set by the nodal points and therefore only the mass changes depending on the filled fluid while the volume remains stable.[1] A countermass is need if a Y-oscillator is used.
For sensors made of glass a built-in reference oscillator eliminates not only long-term drifts due to the aging effects of the material but also temperature changes that influence the elasticity. A reference oscillator therefore makes it possible that only one single adjustment is needed to cover the whole temperature range and also temperature scans of a sample can be performed.[2]
Temperature regulation
Temperature regulation of the measuring cell in a density meter is performed with Peltier elements. This advantageous technology has now replaced the use of water baths. Peltier elements make use of the Peltier effect, a heat flux due to electric current: One side of a Peltier element heats up while the other side cools down depending on the direction of the current flow.[3] Peltier elements therefore allow both effective heating and cooling of the measuring cell and additionally provide precise and fast temperature regulation.
Excitation of the oscillator
Either a system of magnets and coils or Piezo elements can be used to provide electronic excitation of the sensor. While magnets are comparatively inexpensive, the major drawback is that they put additional weight on the oscillating sensor, which has a negative influence on the achievable accuracy. The most precise method to excite a sensor is to use a Piezo element, a crystal or ceramic material that changes its dimension upon applied electrical voltage. However, this technology requires some safety measures in the electronic circuits as this requires high voltages.
Pick-up and evaluation of the oscillation
Pick-up of the oscillation
Optical pick-ups can detect a light beam that is interrupted by a minute coating on an oscillating glass sensor. The pick-ups then record the oscillation period. This technology is very precise, simple, and affordable.
Piezo elements can also be used to represent the period of oscillation if the usable effect of the element is inverted. While the excitation of the sensor is enabled by applying electrical voltage to the Piezo element, detection of the oscillation is also possible: A second Piezo element is then pressurized by the moving sensor unit periodically and generates electric voltage that represents the period of oscillation very accurately. Magnets can be used to measure the period of oscillation as well. Whenever a magnet passes the coil, a little current is induced which can be evaluated.
Evaluation of the oscillating pattern

Although analog processing of the oscillation pattern is affordable and less prone to errors, the precision is limited. Nowadays, digital signal processors (DSP) are state of the art and provide great advantages over the analog technology, even allowing the recognition of energy loss connected to sample viscosity. This is possible due to simultaneous determination of not only the characteristic frequency but also its first harmonic oscillation and the quality factor.
Constant oscillation
Evaluation of the oscillation pattern is performed by keeping the measuring cell continuously oscillating at the characteristic frequency. By recording this constant oscillation not only the frequency of oscillation but also damping can be measured.
Pulsed Excitation Method
The latest development in the evaluation of the oscillation pattern for oscillating U-tubes includes an interruption of the characteristic frequency that leads to a natural fade-out of the oscillation. This procedure is repeated continuously and allows evaluation of the fade-out behavior of the oscillation as well. A series of values is obtained simultaneously, resulting in additional benefits that are not only notable in viscosity measurement and viscosity correction but also in a better repeatability of the density result and improved detection of sample inhomogeneity (e.g. gas bubbles). Further, this new technology enables condition monitoring of the measuring cell.[4]
Basic operations to yield correct and accurate results
The measuring principle of an oscillation-type density meter is based on the correlation between the density $\rho$ of a fluid filled and the corresponding oscillation period $\tau$ (1 divided by frequency of oscillation f) according to the formula:
$\rho = A \tau^2 - B$
Equation 1: The density of a sample $\rho$ can be calculated using the instrument constants (A, B) and the measured oscillation period $\tau$
Adjustment and instrument constants (apparatus constants)
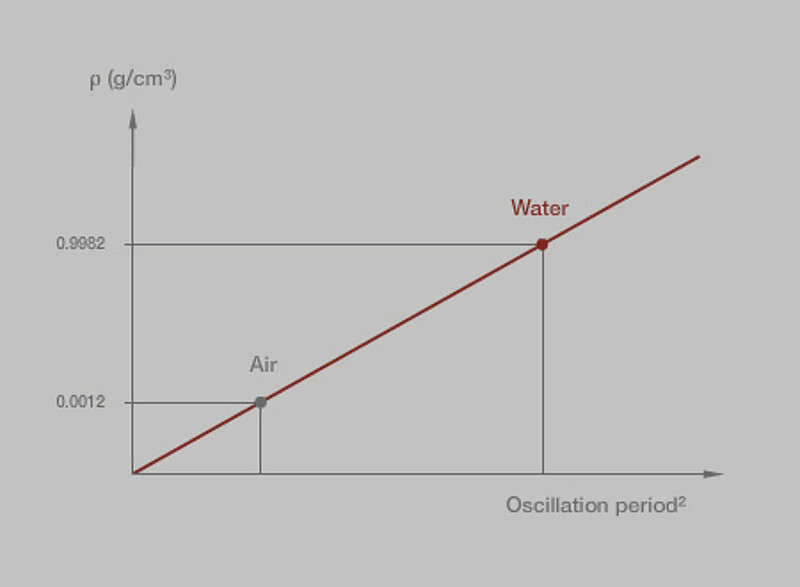
To obtain the instrument constants A, B from the corresponding frequency values, at least two reference liquids with known densities have to be filled into the cell. The instrument constants comprise the cell volume and its mass as well as the spring constant.[6]
Setting the instrument constants of a density meter is called adjustment. An adjustment is an operation to bring the instrument (density meter) into a state in which it is suitable for use, by setting or adjusting the instrument constants. Systematic measuring deviations are removed to an extent which is necessary for subsequent sample measurements.[2]
During an adjustment two standards are usually measured (Figure 5), e.g. dry air and pure (e.g. bi-distilled) degassed water. Knowing the density reference values of the standards means the density values can be linked with a specific oscillation period in order to build up a linear relation between density and oscillation period. Based on this relation unknown densities of different samples can be defined by measuring their period of oscillation.
Calibration
A calibration is a set of operations to establish a relationship between the reference density of a density standard and the corresponding density reading of the instrument. No intervention is made which permanently modifies the instrument.[2]
A calibration is performed to validate the quality of measurements and adjustments.
How viscosity affects the density reading
The oscillation frequency measured not only depends on the density of the filled sample but also on its viscosity. Due to the oscillation of the cell, shear forces (a sort of friction) might be generated between the fluid and the tube wall and result in damping. Damping is promoted with increasing viscosity of the sample and that results in a density over-reading (the density value shown is too high).[7] A force to compensate for damping can be applied in a phase-shifted mode for certain viscosity ranges to take the viscosity error into account. Modern density meters compensate this effect and automatically perform a viscosity correction using a special technique in which two different oscillation modes are applied.[2] After the damping is measured in the fundamental and in the 1st harmonic oscillation the viscosity is interpreted and evaluated using a viscosity calibration curve.
Conclusion
Although the principle of digital density meters is always the same, varying the setup, underlying technologies, or elements makes it possible to cover a great variety of applications and to respond to different sample characteristics. Modern density meters provide great convenience compared to older equipment (e.g. viscosity correction, reference oscillator) or traditional methods.
References
- EN ISO 15212-1: 1999 Oscillation-type density meters – Part 1: Laboratory instruments
- Fritz et al. Applications of densiometry, ulrsonic seed measurements, and ultra low shear viscosimetry to aqueaos fluids. J. of Phys.Chem. B Vol 104, No 15, 3463–3470, 2000
- www.researchgate.net/publication/262179901_Peltier_Effect_in_Semiconductors (last visited 26.03.2018)
- AT 516420 (B1)
- Anton Paar DMA™ 4100 M, 4500 M, 5000 M Reference Guide, instrument software version: from 2.93 (XDLIB016EN-B), 2018
- H. Fehlauer and H. Wolf Density reference liquids certified by the Physikalisch-Techische Bundesanstalt Meas.Sci.Technol. 17 (2006) 2588–2592
- ftp://ftp.unicauca.edu.co/Facultades/FIET/DEIC/Materias/Instrumentacion%20Industrial/Instrument_Engineers__Handbook_-_Process_Measurement_and_Analysis/Instrument%20Engineers%27%20Handbook%20-%20Process%20Measurement%20and%20Analysis/1083ch6_8.pdf (last visited 12.12.2017)