Near Infrared Spectroscopy (NIR)
General aspects
The molecular overtone and combination bands in NIR are typically very broad, leading to complex spectra. Multivariate calibration techniques are often used to extract the desired information. These calibration techniques consider reference data from various test measurements of a group of samples. Using appropriate calibration data and the possible application of multivariate calibration techniques the information gathered from the measured spectra can be correlated to a quantity of a substance in the sample.
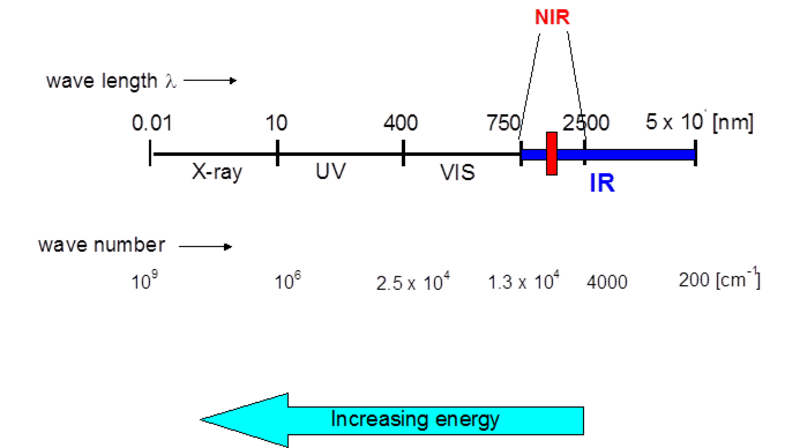
NIR spectroscopy is the method of choice to quantify specific ingredients in liquid samples. Near-infrared light ranges from 750 nm to 2500 nm. The measurement of absorption in this specific range of wavelengths can be used to determine the alcohol content in a wide range of alcoholic beverages such as beers, wines, spirits, and liqueurs.
NIR spectrum of ethanol and water
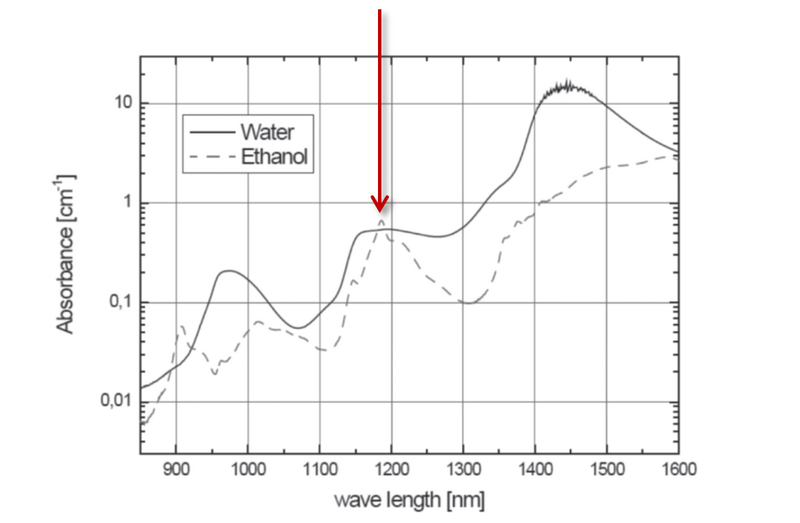
To quantify the alcohol content in alcoholic beverages the NIR spectrum of the sample in the range of the second overtone of the C-H stretching vibration near 1200 nm is analyzed. It utilizes the symmetrical vibration of the methyl group because its pronounced and distinct shape is slightly influenced by the matrix.
In this particular spectral range, the influence of other sample constituents is so small that extremely accurate alcohol results are obtained. Due to the selectivity and linearity of this measuring method, the system only requires an adjustment with water and one ethanol/water solution.
Hardware setup
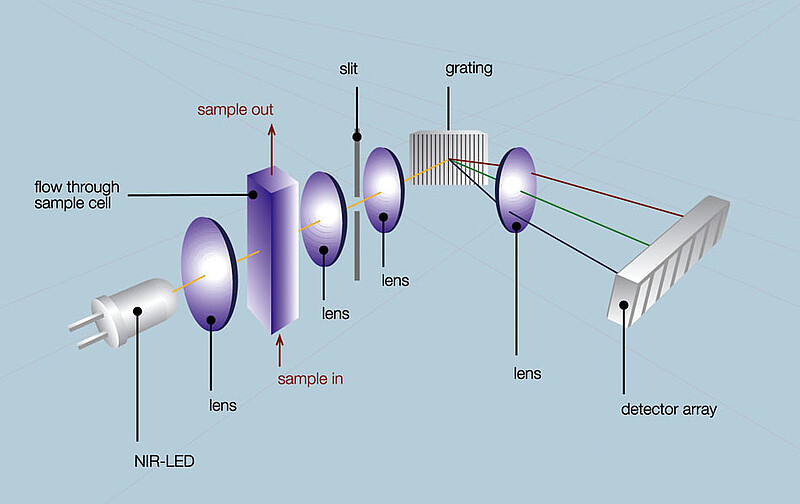
The narrow, highly alcohol-specific range of the NIR spectrum needs to be evaluated with a high-resolution spectrometer.
A light source, a detector, and a diffraction grating enable the detection of the intensity of the transmitted light at different wavelengths. A specific setup of optical components is used to project the light beam towards a detector unit which measures the intensity of the light which has passed through the sample. As a result of that, the loss in intensity at specific wavelengths can be related to the quantity of a specific substance (e.g. ethanol) in the sample.
Baseline evaluation method
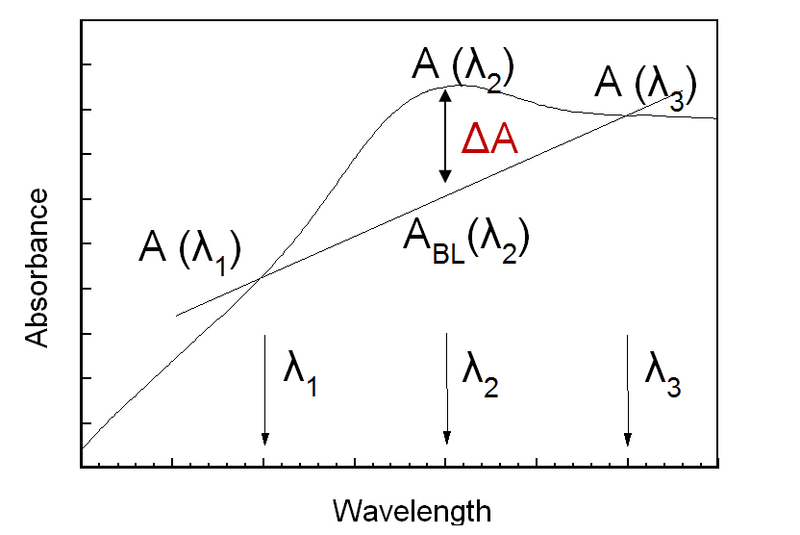
By applying the baseline evaluation method, the contribution of alcohol to the measured absorption can be evaluated. For that purpose the sample’s absorptions A in the specific NIR range at specific wavelengths λ1, λ2, and λ3 are evaluated.
This evaluation algorithm used in NIR spectroscopy is based on the subtraction of a background absorbance from the measured spectra. A linear background crossing the absorption spectrum at two different wavelengths λ1 and λ3 is used. The ΔA, representing the difference of the absorbance wavelength λ2 compared to the formerly calculated baseline, is evaluated. This output is directly related to the quantity of ethanol in the sample.
NIR spectroscopy applied to the alcohol determination in alcoholic beverages
Even though the signal evaluation which is made at ~1200 nm is highly specific to ethanol in the sample, NIR-active species such as the proteins in beers whose absorptions are overlapped with that of ethanol can trigger differences in the measured results. These substances will increase the absorbance measured and therefore lead to an apparent increase of alcohol in the sample.
To ensure proper performance on real-life samples, suitable corrections (multivariable calibrations) are applied.