Capillary flow porometry basics: measuring through pores
Solid-fluid separation processes are used to purify water and gases, provide personal protection against bacteria and viruses, and to separate two electrodes in batteries while permitting passage of electrolyte. The efficiency of any separating “barrier” in a given application depends on the size of pores that can exclude or trap particles above a certain size. This article explains the underlying principles of the measurement of the size distribution of through pores in laboratory samples using a capillary flow porometer and how important mechanical and physical test parameters are optimized in order to obtain the most accurate data.
Capillary flow porometry
Capillary flow porometry (CFP) is a pore size measurement technique that uses liquid expulsion calculation for the measurement of the sizes of pores that penetrate completely through a solid, so-called through pores. It is one of the most important methods for characterizing filter media and porous membranes in the pore size range from 13 nm (when using a wetting fluid with a surface tension of 16 dynes/cm and a shape factor of 0.715) to 500 μm. The calculation of pore size from pressure, surface tension, and pore shape is given later.
Types of pores and other porometer definitions
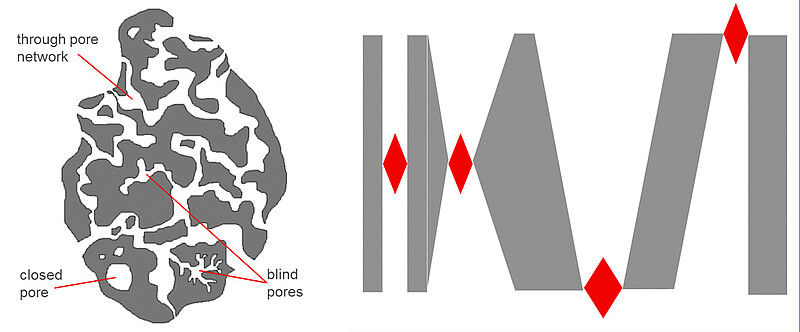
Closed pore: a pore completely surrounded by impenetrable solid, isolated[1] from any surrounding fluid
Open pore: a pore having access to the surface of a solid[1] (directly or indirectly); a blind pore or through pore
Blind pore: an open pore that connects to only one external surface[1, 2] (directly or indirectly), a pore closed off only at one end such that fluids can still flow or diffuse in and out
Through pore: a pore that directly connects two external surfaces of the solid[1, 2], usually opposite faces of a thin or two-dimensional solid
Limiting pore size: a critical pore size that contributes to the porous structure’s permeability[3]; the smallest wall-to-wall dimension within a through pore, it may be located at any point along the length of the pore
Mean flow pore size: average pore size based on the point at which 50 % of the dry flow intersects the wet flow data
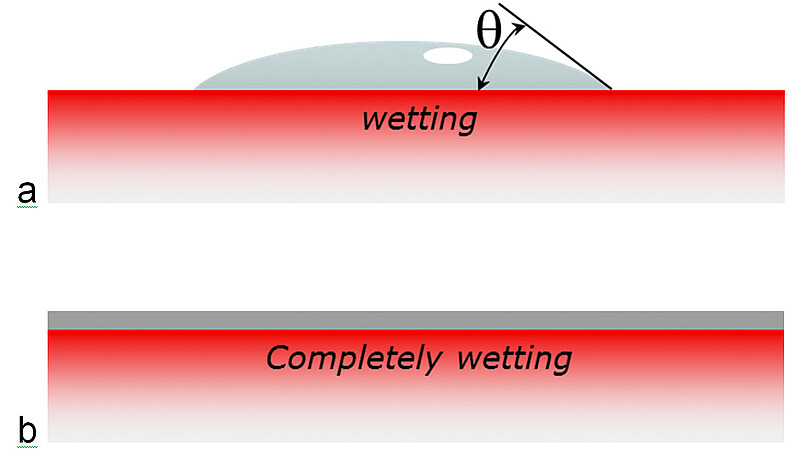
Contact angle: the tangent at the interface that a liquid makes with a solid
Bubble point: the pressure at which a wetting liquid is forced from the largest limiting pore size in one or more through pores. Classically it is the pressure at which a steady stream of bubbles appears from the sample through a thick layer of supernatant liquid[4]
Tortuosity: deviation from a straight path described by pore geometry: turns, multiple narrowings of pore diameter along its length and branching of through pores all contribute to tortuosity
Measuring through pores: The porometer principle
The porometer principle is based on the following schema: the sample under evaluation is wetted with a liquid to fill at least all through pores. Increasing gas (air or nitrogen) pressure (P) is applied to one side of the sample.
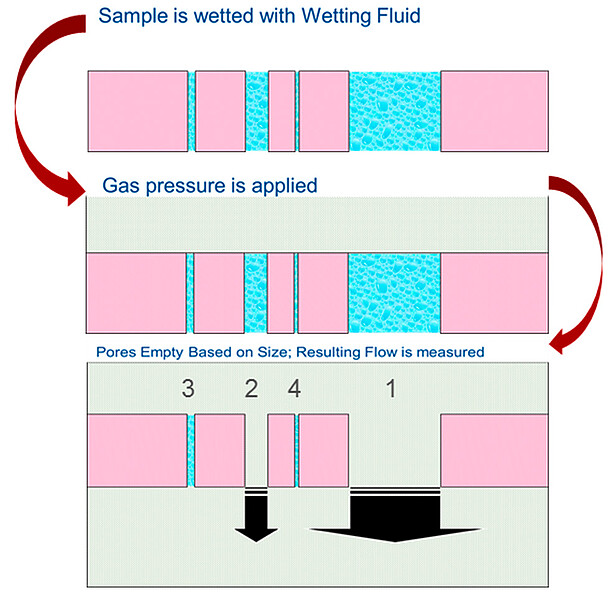
The liquid will be expelled from each through pore according to its size (diameter, d) at a defining pressure according to the Washburn equation
$$Pd = {4y \cos θ}$$ (1)
Where γ is the surface tension of the liquid and θ is the contact angle between the liquid and the sample.
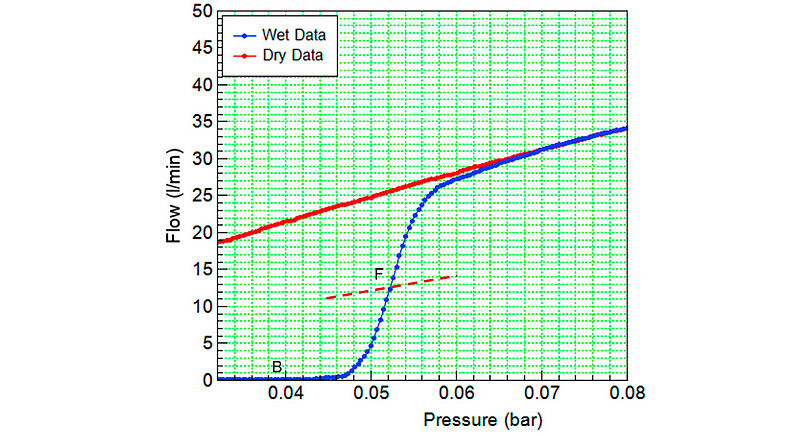
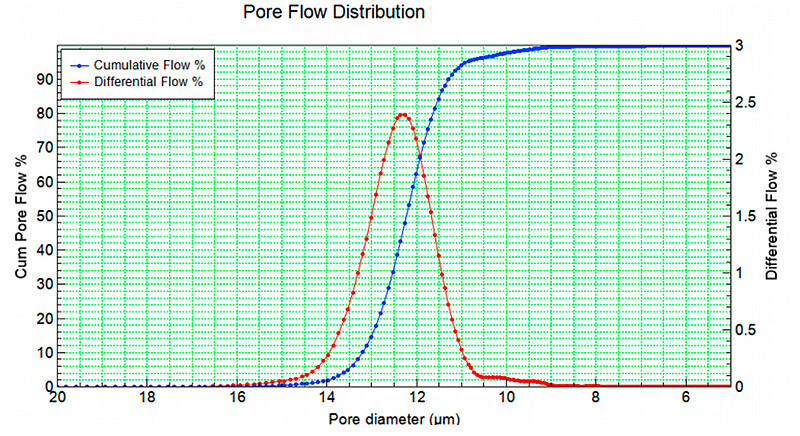
The resulting flow of gas through empty pores is measured to calculate the largest pore size from the bubble point (point B, Fig 4). A second data set of flow versus pressure through the completely dry sample is used in combination with the wet flow data to calculate mean flow pore size (F, Figure 4) and a pore size distribution of all through pores within the range of the measurement system. The largest pore (lower boundary of the pore size distribution) is determined by the flow at which the wet flow data linearizes (i.e. basically equal to the dry flow rate). The pore size distribution is normally represented as cumulative flow (percentage of total or volume per unit time) or differential flow, the first derivative of the cumulative curve as shown in Figure 5.
How porometry measurements are optimized
In order to obtain optimal and reproducible data, the dynamic generation of pressure and measurement of flow should be done in a controlled and sample-responsive manner. Sample holders and liquids used should be sample-relevant.
Pressurization
When the pressure on the sample is increased, the porometer needs to measure the resulting total flow through all pores that newly emptied (if indeed any did) and those pores that were previously emptied. It is important, therefore, that the flow should be equilibrated before the pressure is again increased.
Using equilibrated data sets using some incremental increase of pressure (simply defined as start pressure, end pressure, and number of data points between them) allows every sample to be automatically optimized according to its individual characteristics. If long equilibration times cause excessive evaporation of the test liquid, simply choose one with a lower vapor pressure.
Relying on a fixed pressure ramp, or scan, for example, can mean that the pressure is starting to empty smaller pores before the larger pores have completely emptied; this results in a shift in apparent pore size distribution to smaller diameters than when the flow is allowed to equilibrate. Fixed scans make it virtually impossible to compare dissimilar samples, samples of different geometries, thickness, or size, or to find small but important differences between different lots or batches of material that should nominally have the same pore size distribution but in fact do not.
Pressure measurement
The dynamic pressure applied to the sample is measured upstream of the sample using pressure transducers under the condition of zero flow so as not to introduce any venturi or other artifacts, and as close to the sample as practically possible to eliminate any pressure drop between the control unit supplying the gas and the sample holder. This is achieved using a pitot tube type arrangement which transfers pressure at the sample to the transducer(s) which then do not have to be mounted directly into the sample holder. This also eliminates the need to recalibrate the porometer for different sample types.
Flow measurement
The resulting flow of gas through the sample is measured upstream of the sample. The gas supply is automatically adjusted to maintain pressure on the samples as an increasing number of pores are emptied and as, therefore, the resulting flow increases. The flow is not measured downstream of the sample – doing so would require the sample to be sealed on both sides and therefore be doubly sensitive to leaks in the assembled sample holder.
Bubble point and pore size distribution
Bubble point and pore size distributions should be measured using the same sensing method, i.e. equilibrium flow as a function of applied pressure, and, for example, not pressure drop for bubble point, so that the upper boundary of the pore size distribution (largest pore) is determined contiguously with and continuously into the remainder of the distribution (and continuous flow better corresponds to the legacy ‘continuous stream of bubbles’).
Sample preparation
Samples must be sealed into a sample holder to prevent gas bypassing and flowing around the sample. Different interchangeable holders are used for thin sheet textiles and membranes, thick samples and tubular (hollow-fiber membrane/ceramic) samples.
The flow through the sample is not only a function of the size of open through pores but the total number of them which itself is a function of their density (number per unit area) and total geometric area of sample exposed, i.e. total permeability. Therefore it is not uncommon to adjust the size of the sample to optimize the total flow with respect to flow sensors installed in the porometer. Low-permeability samples might need to be analyzed as a larger piece of membrane/textile in a larger diameter holder, longer tubes or multiple hollow fibers run as a single sample. High-permeability samples can be reduced in size or a shadow mask employed to blank off some of the total area of flat sheets.
Liquids
The usual liquid employed is a fluorocarbon (FC), selected for its complete wetting behavior, i.e. having a contact angle of zero with all solids. Different fluorocarbons are available – the primary difference between them being vapor pressure. Higher vapor pressure FCs are useful when running ‘wet before dry’ so that there is reduced opportunity for rewetting of the through pores from blind pores (during flow beyond the point of emptying the smallest through pores any excess fluid is evaporated). They also make for easier cleanup since the sample holder and support grids easily dry between samples. However, FCs with too high a vapor pressure could evaporate prematurely from pores yet to be emptied by pressure because of the high gas flow resulting from large pores already emptied in high-permeability samples. Low vapor pressure FCs will not evaporate to the same extent, and so while they can be beneficial for high-permeability materials, they can cause undesirable rewetting during or after a wet run; hence they are often associated with running ‘dry first’, then wet.
Other liquids that could be employed (notwithstanding the need to know the contact angle with the sample under test) include mineral oil, alcohols, and water. And, just as for FCs, if the wetting fluid has a very high vapor pressure (for example isopropanol or ethanol), it will readily evaporate from all of the pores over time – even without applying a pressure to it. If the wetting liquid has a low vapor pressure the sensitivity to high-pressure gas flow through the pores already opened causing evaporation from adjacent pores is reduced. Evaporation from the pore structure during an extended time of analysis is not really important if the only interest is the bubble point and not a complete pore size distribution.
When considering any liquid to be used in CFP there must be no chemical or physical interaction such as dissolution, swelling, etc. with the sample under test.
| Fluid | Benefits |
| Porofil | Excellent universal wetting fluid |
| Galdfil | Same as above but with lower vapor pressure |
| Ethanol | Good for bubble point only as it has high vapor pressure |
| Isopropanol | Good for bubble point only as it has high vapor pressure |
| Mineral oil | Good, but limited wetting capability |
| Silicon oil | Good, with virtually zero vapor pressure |
| Water | Good for hydrophilic materials |
The basic assumption in applying the Washburn equation is that all through pores are perfect cylinders with circular cross-section; pore sizes by this method, then, do not necessarily correlate with particle rejection results based on woven sieves. For real samples this assumption can be retained, or some shape factor, S, can be included to empirically accommodate a deviation from this ideal geometry (a circular pore has a shape factor value equal to 1). For example a square pore of side d can be assigned a shape factor, S, 0.785 relative to a circle of diameter, d, based on
$$S = 4\pi A/l^2$$ (2)
where A is the pore cross-sectional area and l is the length of the pore perimeter. For a completely wetting fluid, where θ is zero, cosine = 1 the Washburn equation (Eqn 1) can then be written as follows for pore diameter calculation:
$$d = {4y\cdot S \over P}$$ (3)
In the absence of any specific information about pore geometry, a value of 0.715 for the shape factor is commonly employed when analyzing membrane filters. S can also be used as a factor to align pore size values with other pore size measurement techniques.
Pore tortuosity, a factor separate from the shape factor, can be applied to take into account differences between “hydraulic” pore length, L, and sample thickness, t, and is used for pore area and pore volume calculations. It is applied empirically though according to the following concept:
$$\tau = {L \over t}$$ (4)
Certain methods, such as ASTM F316[4], use a conversion factor called tortuosity but it is in fact an empirically derived shape factor. Factors such as pore shape and tortuosity are generally used arbitrarily to bring various pore sizing techniques into empirical agreement and not to define true pore structure parameters.
Conclusion
Through pores in filter media and other thin sheet-like or tubular structures are easily and quickly characterized by capillary flow porometry which employs the forced expulsion of a wetting fluid and a simple inverse pressure-pore-size relationship. Accuracy depends on a number of factors, including optimized porometer mechanical design as well as operational and analytical parameters.
Read more about pore size measurement techniques, including gas adsorption and mercury intrusion.
References
- Elsayed, Y. and Lekakou, C. (2016). “Designing and modeling pore size distribution in tissue scaffolds” in P Tomlins (ed.), Characterization and design of tissue scaffolds, Elsevier.
- “Standard guide for assessing microstructure of polymeric scaffolds for use in tissue-engineered medical products” F2450, ASTM International
- Wise, W. R. (1992). “A new insight on pore structure and permeability”, Water Resources Research, vol. 28, no. 1, pp. 189–198.
- “Standard test methods for pore size characteristics of membrane filters by bubble point and mean flow pore test” F316, ASTM International.
- Washburn, E. W. (1921). “Note on a method of determining the distribution of pore sizes in a porous material”, Proc. Natl. Acad. Sci. vol 7, pp. 115–116.