Mercury Intrusion Porosimetry Basics: Measuring Pores in Solids
This article explains the underlying principles of the measurement of the size distribution of pore structures in laboratory samples using a mercury intrusion porosimeter, and how important test parameters are optimized in order to obtain the most accurate data. Materials routinely characterized by this technique include traditional and advanced ceramics, heterogeneous catalysts, pharmaceutical solid dosage forms, building materials, geological samples, and battery components.
Introduction to mercury intrusion porosimetry
Mercury intrusion porosimetry (MIP) is a pore size measurement technique that uses non-wetting liquid penetration to measure the size and volume of pores in a wide range of porous solids. It is one of the most significant methods for characterizing porous materials over a pore size range from approximately 3 nm (depending on the exact contact angle between mercury and the solid surface) to approximately 1000 μm. The mercury intrusion method allows pore sizing well above 500 nm – beyond the realm of gas physisorption.
Types of pores and other porosimeter definitions
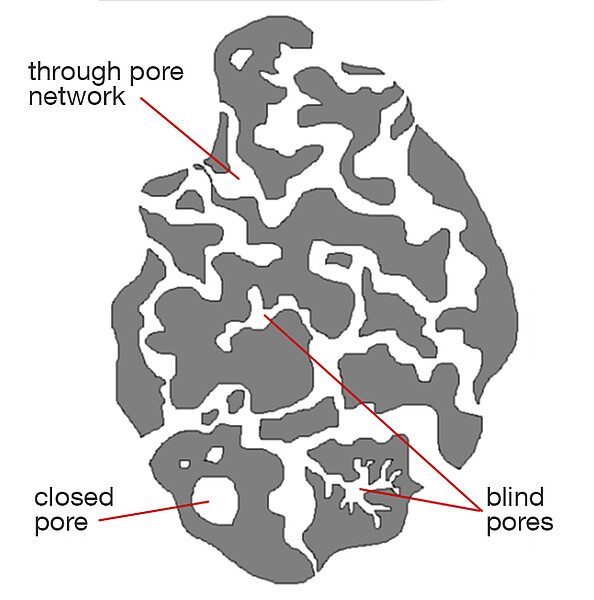
Closed pore: a pore completely surrounded by an impenetrable solid, isolated[1] from any surrounding fluid
Open pore: a pore having access to the surface of a solid[1] (directly or indirectly); a blind pore or through pore
Blind pore: an open pore that connects to only one external surface[1,2] (directly or indirectly); a pore closed off only at one end, such that fluids can still flow or diffuse in and out
Through pore: a pore that directly connects two external surfaces of the solid[1,2], usually opposite faces of a thin or two-dimensional solid
Mesopore: a pore whose nominal diameter or width lies in the range 2 nm to 50 nm[3]
Macropore: a pore whose nominal diameter or width is larger than 50 nm[3]
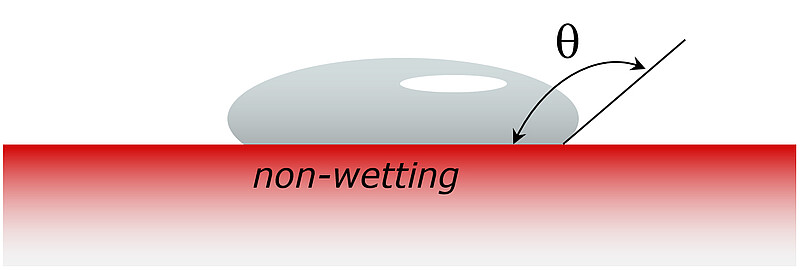
Contact angle: the tangent at the interface that a liquid makes with a solid
Tortuosity: deviation from a straight path described by pore geometry: turns, multiple narrowings of pore diameter along its length, and branching of through pores all contribute to tortuosity
Measuring pores: the porosimeter principle
History
A then-new method of measuring pore size and volume through the forced intrusion of mercury (a non-wetting fluid on most surfaces) under pressure into the pores of a solid was first proposed by Edward Washburn in a short communication, dated February 12, 1921, to the National Academy of Sciences in their “Proceedings” journal[4].
Schema
The porosimeter principle is based on the following operating sequence: The sample under evaluation is placed into a suitable holder or cell called a penetrometer. The penetrometer is constructed of glass and is comprised of (i) a cylindrical section large enough to accommodate typical samples which can be pellets, granules, other pieces (typically <10 mm although larger pieces can usually be accommodated in specialized holders), or powder, and which has a ground glass lip to which a metal plate is subsequently affixed and sealed using vacuum grease, (ii) a capillary glass stem which connects to the sample area (Figure 2).
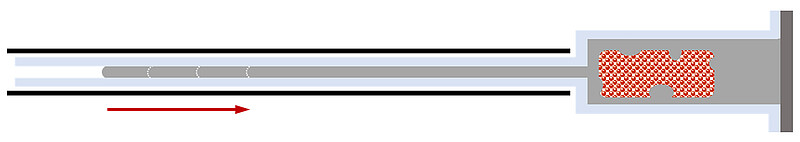
The cell is installed into a pressure chamber within the porosimeter, evacuated, and backfilled with mercury. Initially, gas pressure is applied to create the measurement – up to 0.345 MPa (50 psia) for evaluation of larger pores. If required, the sample cell is subsequently transferred to an oil hydraulic pressure chamber which can apply pressures up to 414 MPa. As pores are filled, mercury moves out of the capillary stem. This stem is surrounded by a metal sleeve or sheath which together with the column of mercury constitutes a capacitor, which is in turn arranged in an electrical sensing circuit, thereby functioning as an electronic burette. The amount of mercury intruded into pores can then be quantified (the electrical response having been calibrated against known volumes of mercury). After each pressurization event (pneumatic and hydraulic), the pressure is decreased – with or without recording the volume of mercury leaving the pores as desired – returning the system to ambient atmospheric pressure. This depressurization event resulting in retraction of the mercury is referred to as “extrusion”. Note, it is the mercury’s own non-wetting behavior that pushes it back out - there is no second fluid phase positively displacing it.
Intrusion and pore size
During pressurization mercury is forced into each pore as per its size (diameter, d) at a defining pressure according to what is now referred to as the Washburn equation[4].
$$Pd = {-4y \cos θ}$$ (1)
where γ is the surface tension of the liquid and θ is the contact angle between the mercury and the sample. θ is typically within the range 120° to 150°, and a value of 140° is most commonly employed.
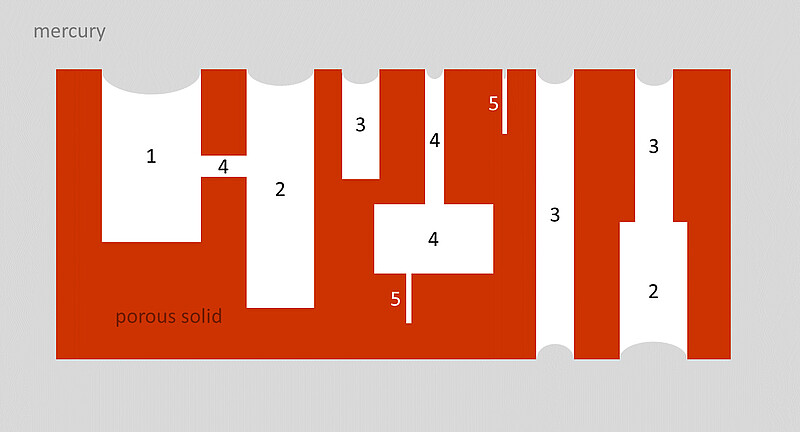
Hence, the largest pores which are directly accessible at the surface are intruded into first, followed, as the pressure increases, by ever-smaller pores accessible at the surface or connected to pores already filled (Figure 4). It is important to note that unfilled pores of greater diameter than the pores that connect to them will fill at a pressure associated with the next smaller pore. The dynamic range of mercury intrusion porosimetry covers pore sizes from approximately 3.2 nm to approximately 1000 µm – the exact values depending on the contact angle used in the calculation.
The resulting intrusion curve (Figure 5) is used for the calculation of pore volume and pore size.
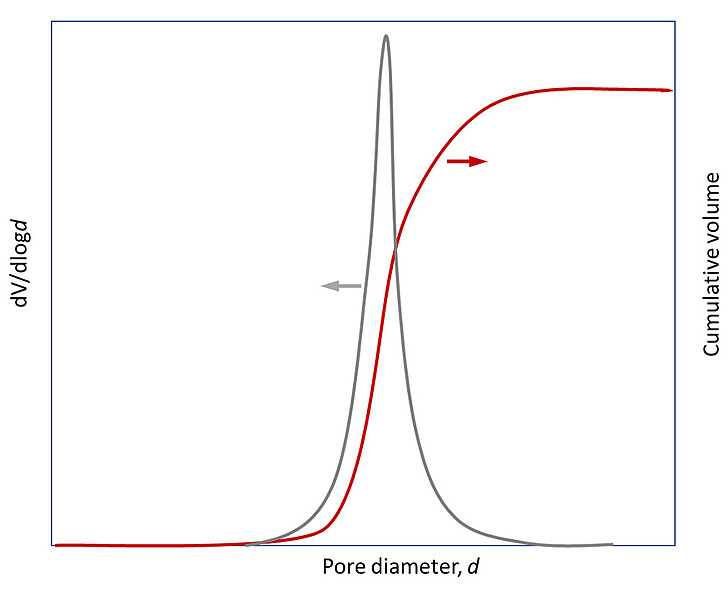
The pore size distribution is normally represented as cumulative pore volume (percentage of total or volume per unit mass) or the first derivative of the cumulative curve, dV/dlogd (Figure 6) as a function of pore diameter (d) or radius.
The assumption always is that the pores are perfect cylinders with circular pore openings. In the usual manner of treating distributed data typical of many analytical physical measurements, in addition to the entire curve being presented, the mode, mean, and median pore size values are calculated.
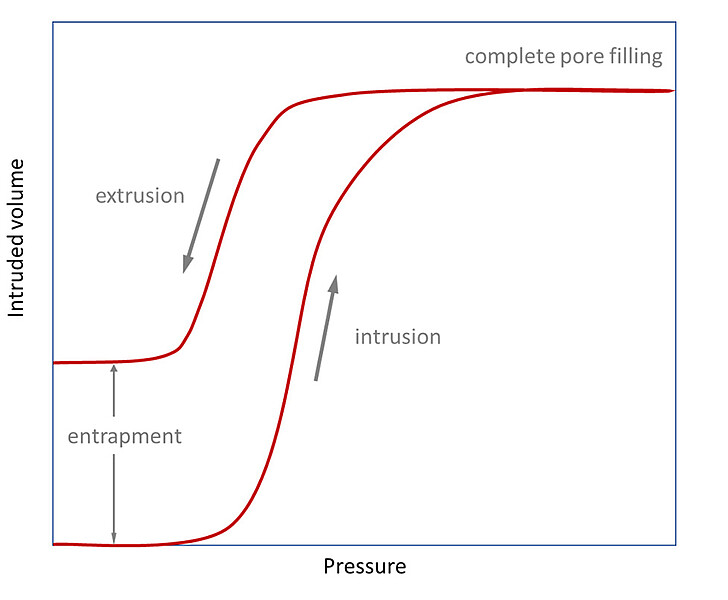
Hysteresis
Intrusion into pores is not a completely reversible process without hysteresis. It is usual that extrusion of mercury from the pores occurs at a pressure lower than that required for intrusion, and furthermore some mercury remains inside the pore network, or “entrapped”. These phenomena are related to the difference between dynamic advancing (intrusion) and receding (extrusion) contact angles, and pore network complexity – particularly the presence of “ink-bottle” pores, i.e. those having necks that are narrower than the main pore body.
Other calculations
The raw intrusion/extrusion data can be used to calculate a number of other related properties and characteristic values. For example, following the assumption that all the pores have circular cross sections, and are not connected in an ink-bottle-fashion, the nominal total and volume distribution of pore surface area, S, can be calculated according to the simple geometrical relationship:
$$S = {4V \over d}$$ (2)
If the pore spaces are actually voids between individual particles, that “pore size” information can be used to calculate an effective particle size distribution based on the simple premise that small particles have small voids between them, and large particles produce larger interparticle voids.
Prior to pore filling, powder samples that don’t assume maximum packing density naturally become compressed by the surrounding mercury, which forms a non-intruding envelope around the powder mass until the pressure is sufficient to penetrate the surviving voids.
Tortuosity and permeability are also calculable based on simple models of fluid flow in cylindrical channels, as well as total porosity and mean pore diameter. Throat/pore ratios can be calculated from the ratio of intrusion to extrusion values assuming the sole cause of hysteresis is due to “ink bottle” geometry.
The fractal dimension can be calculated, and thus distributions of different sizes can be compared and contrasted for similarity and to differentiate between powder compression behavior and pore filling.
How porosimetry measurements are optimized
In order to obtain optimal and reproducible data, the generation of pressure and measurement of intruded volume are performed in a controlled and sample-responsive manner.
Evacuation and starting pressure
In order to properly fill the sample holder and ensure that the intrusion pressure corresponds only to the size of the pore openings, all air must be removed from the holder and the sample itself before admitting mercury. This is aided by evacuation through a cold-trap which serves to condense any vapors that would otherwise interfere with both filling and subsequent measurement.
The pressure at which the sample holder is filled with mercury defines the largest pore size from which the pore size distribution can be measured. A filling pressure of 14 hPa (0.2 psia) corresponds to a pore diameter of 1100 µm (assuming a contact angle of 150°).
Pressurization
When the pressure on the sample is increased, the porosimeter needs to measure the resulting volume intruded into yet-unfilled pores. It is important, therefore, that the rate of pressurization not be too rapid to prevent one pore size not being completely filled before intrusion starts into the next, somewhat larger pore(s).
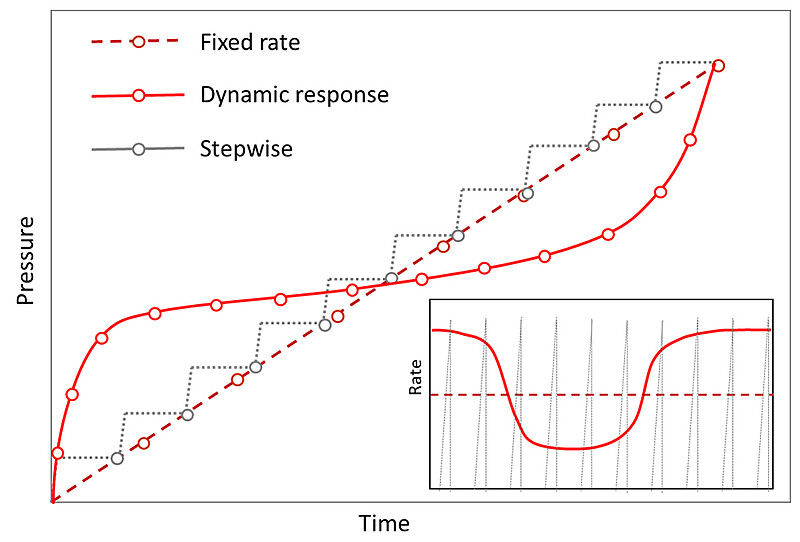
Fundamentally, there exist three distinct means of pressurization: a constant rate of pressure increase, a rate of pressure increase that dynamically responds to the volume being intruded, and a step-wise function (Figure 7).
Constant rate: This is commonly used to screen porous solids, and when an analysis time as short as reasonably practicable is desired.
Dynamic response: This is most widely applicable, especially when the pore sizes are not known and a high-resolution data curve is desirable in order to produce a detailed pore size distribution. When the intruded volumes are small within a given time period, the pressurization rate is increased, and when the intruded volumes are larger, the rate is automatically slowed.
Step-wise: This is used when fixed values of pressure are found to be helpful in qualifying manufactured porous materials for example. A pressure-holding time is associated with each pressure step.
The maximum pressure achievable corresponds to the lowest limit in the measurable pore size distribution. The experimentally practicable limit of 414 MPa (60,000 psia) corresponds to a pore diameter of 3.2 nm (assuming a contact angle of 140°).
Standard methods
Mercury intrusion porosimetry is recognized in a number of international standard test methods:
Organization | Standard number | Title |
ASTM | D4404 | Determination of pore volume and pore volume distribution of soil and rock by mercury intrusion porosimetry |
ASTM | D4284 | Determining pore volume distribution of catalysts and catalyst carriers by mercury intrusion porosimetry |
ASTM | D6761 | Determination of the total pore volume of catalysts and catalyst carriers |
ISO | 15901 | Evaluation of pore size distribution and porosity of solid materials by mercury porosimetry and gas adsorption – Part 1: Mercury porosimetry |
USP | 267 | Porosimetry by mercury intrusion |
ASTM | D2873* | Interior porosity of poly (vinyl chloride) (PVC) resins by mercury intrusion porosimetry |
*This standard has been withdrawn by ASTM but is included here for reference.
Conclusion
Porous solids having pores in the range 3.2 nm to 1100 µm can be characterized by the forced intrusion of mercury under pressure. The associated pressures used range from 14 hPa to 414 MPa, employing a combination of pneumatic and hydraulic methods. The method is capable of generating high-resolution pore size distributions over a very wide dynamic range and is a complementary technique to gas adsorption when characterizing meso- and macroporous materials.
References
- Elsayed, Y. and Lekakou, C., 2016. Designing and modeling pore size distribution in tissue scaffolds. In: Characterisation and Design of Tissue Scaffolds. Woodhead Publishing, pp.23-43.
- ASTM F2450-18, Standard Guide for Assessing Microstructure of Polymeric Scaffolds for Use in Tissue-Engineered Medical Products, ASTM International, West Conshohocken, PA, 2018.
- Sing, K., 1985. Reporting physisorption data for gas/solid systems with special reference to the determination of surface area and porosity (Recommendations 1984). Pure and Applied Chemistry, 57(4), pp.603-619.
- Washburn, E., 1921. Note on a Method of Determining the Distribution of Pore Sizes in a Porous Material. Proceedings of the National Academy of Sciences, 7(4), pp.115-116.
Further reading
Rouquerol, J., Baron, G., Denoyel, R., Giesche, H., Groen, J., Klobes, P., Levitz, P., Neimark, A., Rigby, S., Skudas, R., Sing, K., Thommes, M. and Unger, K., 2011. Liquid intrusion and alternative methods for the characterization of macroporous materials (IUPAC Technical Report). Pure and Applied Chemistry, 84(1), pp.107-136.
Lowell, S., Shields, J., Thomas, M. and Thommes, M., 2004. Characterization of Porous Solids and Powders: Surface Area, Pore Size and Density. Dordrecht: Springer Netherlands.