Particle size analysis methods: Dynamic light scattering vs. laser diffraction
There are two well-established methods for determining the particle size of a sample: dynamic light scattering and laser diffraction. Choosing which particle size analysis method to use requires consideration of the expected size range, the sample type (liquid or solid), the amount of available sample, the chemical stability, and the application field. However, the physical principle behind each technique is also important, and the choice of the most suitable one is not always straightforward.
This article describes the principal differences between dynamic light scattering and laser diffraction, and it also provides an overview of the options for data interpretation and possible comparison.
Comparison of particle sizing methods: Laser diffraction vs. dynamic light scattering
| Characteristics | Dynamic light scattering (DLS) | Laser diffraction (LD) |
|---|---|---|
| Assumption |
Particles are spherical |
|
| Size range | 0.3 nm to 10 µm | 10 nm to 3500 µm |
| Theory of particle size measurement |
|
|
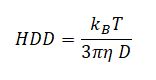
| Equivalent diameter* | Hydrodynamic diameter (HDD):
|
|
| Initial weighting model | Intensity-based
|
Volume-based
|
| Mean particle size result | Monodisperse sample:
|
|
| Parameters of the particle population |
|
|
| Other weighting models | Recalculation of the intensity-based distribution to a number- and volume-based one is possible when the refractive index of the particles is known. | Recalculation of the volume-based distribution to a surface- and number-based one is possible. The refractive index does not have any function in this case. |
| ISO norm | ISO 22412 | ISO 13320 |
Results and data interpretation
Is it possible to compare DLS results with laser diffraction results? Which parameters should be compared?
The DLS particle size analysis technique and laser diffraction method provide results which are based on different equivalent diameters and weighting models.
For many samples, then, results measured with DLS and laser diffraction are not directly comparable and a deviation of 10 % or more between the results is to be expected. To decrease the deviation, the same weighting model should be used for comparison. When using the dynamic light scattering technique, it is possible to recalculate the volume-weighted distribution as well as D-values.
However, any kind of recalculation will introduce an error that adds to the initial one related to the assumption of spherical particles. Therefore, calculations from the raw data are always more reliable than a recalculation.
Understanding the difference between DLS and laser diffraction results
The following considerations are crucial for understanding the difference in the results and the inaccuracy of the comparison:
- In order to directly compare the technologies, the results of a DLS measurement have to be recalculated to obtain a volume-based distribution
- Mean size is based on different weightings: D[4,3] based on volume; HDD based on intensity
- The median (D50) should be considered to get a more accurate “average particle size”
Dynamic light scattering (DLS) results
DLS measurements provide results as the hydrodynamic diameter (HDD) and peak size (see Figure 1 and 2).
 are calculated.")
The HDD cannot be measured by laser diffraction, but the median of the peak size may be obtained by using further calculations. Therefore, the recalculation of the particle size distribution from intensity- to volume-based and then the calculation of the volume-weighted D-values are necessary for a reasonable comparison.
By means of the material refractive index, the intensity-based result can be recalculated into the volume-based one.
 correlation function and hydrodynamic diameter (HDD); (b) and (c) particle size distribution and peak size in the intensity- and volume-based distribution, respectively")
Laser diffraction (LD) results
The D-values provided by laser diffraction results do not give information about the peak size but describe the whole particle size distribution (see Figure 3). In order to define the particle size of the investigated sample, the median or the mean size (e.g., D [4,3]) has to be considered.
")
Comparison of DLS and LD results
It can be observed that although there is a certain similarity (difference smaller than 10 %) between the HDD intensity-weighted (DLS: 0.13 µm) and the D50 volume-weighted (LD: 0.14 µm), the comparison would not be accurate because they have two different meanings (D50 is not a mean but a median), and they are based on different weighting models.
For this reason, from the recalculated DLS volume-based distribution, the D-values can be determined and used for the comparison with the laser diffraction results (see Table 1). The comparison between the volume-weighted D-values is shown below. The difference is higher than 20 %.
| Instrument | D10 [µm] | D50 [µm] | D90 [µm] |
|---|---|---|---|
| LD | 0.06 | 0.15 | 0.34 |
| DLS | 0.08 | 0.10 | 0.14 |
Table 1: Comparison of volume-weighted D-values derived from DLS and LD for the polystyrene latex
The difference in results obtained from the two different techniques might be confusing at first glance, thus making the decision of which technique to choose even more challenging. In this case, however, it is useful to consider the sample type.
Which technique for which application?
The following points should be taken into account:
| Conditions | DLS | LD |
|---|---|---|
| Sample type | Liquid dispersions (liquid/liquid, powder/liquid) | Liquid dispersions, dry powders |
| Sample amount available | Liquid sample: µL to mL Dry samples: mg to g | Liquid sample: mL Dry samples: g |
| Sample recovery | Always possible. | Not always possible. |
| Temperature control | Always possible, typically from 0 °C up to 90 °C | Possible to measure at different temperatures with the suitable accessory |
| Quality parameters |
|
|
| Method development | No method optimization necessary. | Method optimization necessary for new samples. |
| Measurements of highly concentrated liquid samples | Possibility of measuring undiluted samples up to 70 % (m/v), otherwise pre-dilution is possible before filling the cuvette. | The sample is directly diluted in the liquid dispersion unit. The stirrer, ultrasound, and the circulation help to adjust the particle concentration (obscuration) in the instrument. |
| Lower size limit | Primary particles in the lower nanometer range (typical lower size range 0.3 nm). | LD is less sensitive to the weak signals coming from small particles in the nanometer range (<100 nm) and the accuracy can be limited. |
| Measurement time | Both techniques are very fast (a few minutes). In some cases, laser diffraction measurements can be faster than DLS measurements. | |
| Detection of impurities | Small contaminants in a very low concentration will be observed by dynamic light scattering more readily than by laser diffraction. | |
| Dispersion stability | Laser diffraction is more suitable for analyzing samples that have large particles (>10 µm). The intensity signal is stronger and results are related to the particle volume; dispersion via ultrasound, stirring, and circulation ensure that particles remain in suspension. There is no sedimentation risk like with the DLS technique. | |
| Statistics | The accuracy of results and the repeatability (relative standard deviation %) have to be considered, e.g., RSD <5 %. | |
| Typical applications | Research and quality control:
| Quality control:
|
Conclusion
Laser diffraction and dynamic light scattering are particle sizing methods that are well-established in both research and industry. Deciding on which technique to use for the particle analysis of a specific substance requires consideration of a number of factors, including the goal of the measurement (e.g., measurement of primary particles or agglomerates), the available sample amount, ease of sample preparation, measurement duration, and the nature of expected impurities. Results measured by laser diffraction can be compared with results measured by DLS and vice versa, but this comparison must always be assumed to include a significant deviation. Therefore, comparison is best carried on results determined using the same technique.
Learn more about dynamic light scattering which is used in particle analyzers such as the Litesizer series
Learn more about laser diffraction which is used to determine particle distribution by the PSA series
Read more about laser diffraction for particle sizing
Look up the principles of dynamic light scattering
Read about particle size analysis of food, pharmaceuticals, paints and coatings, and building materials
References
1. Gregorová, W., Pabst, E. (2007). Characterization of particles and particle systems. old.vscht.cz/sil/keramika/Characterization_of_particles/CPPS%20_English%20version_.pdf. [Online].
2. Jonasz, M. Nonsphericity of suspended marine particles and its influence on light scattering. s.l. : Limnol. Oceanogr. 32:1059–1065, 1987.