Amplitude sweeps
Amplitude sweeps are useful in practice to describe the behavior of dispersions, pastes, and gels; for example, for use in the food, cosmetics, pharmaceutical, and medical industries, and for coatings, sealing compounds, and lubricating greases. For amplitude sweeps, the deflection of the measuring system is increased step-wise from one measuring point to the next while keeping the frequency at a constant value (Figure 1).
There are two modes of operation for presetting the deflection:
Strain sweep (shear-strain-amplitude sweep, with controlled-shear deformation CSD)
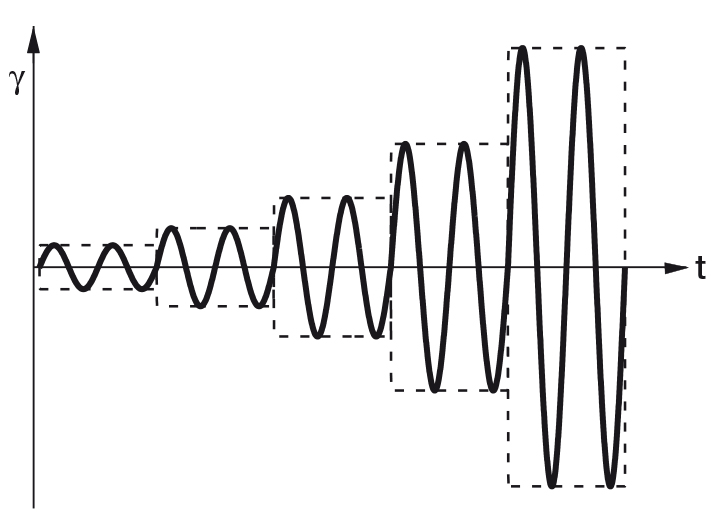
Stress sweep
(shear-stress-amplitude sweep, with controlled shear stress CSS) The frequency can be stated in one of two ways:
a) As frequency f in Hz; 1 Hz is one oscillation per second. The disadvantage: Hz is not an SI unit.
b) As angular frequency ω in rad/s or in s-1, as rotational oscillation. These units are SI units. Therefore, it is recommended to work with angular frequencies. For typical amplitude sweeps, an angular frequency of ω = 10 rad/s is generally used. To convert between the two frequencies, the following holds: ω = 2π ⋅ f with angular frequency ω in rad/s, circle constant π = 3.14 and frequency f in Hz.
f = 10 Hz corresponds to ω = 62.8 rad/s, or ω = 10 rad/s corresponds to f = 1.6 Hz.
Limit of the linear viscoelastic region (LVE) region and viscoelastic character
The measuring results of amplitude sweeps are usually presented as a diagram with strain (or shear stress) plotted on the x-axis and storage modulus G' and loss modulus G'' plotted on the y-axis; both axes on a logarithmic scale (Figure 2).
The limit of the linear viscoelastic region (abbreviated: LVE region) is first determined. The LVE region indicates the range in which the test can be carried out without destroying the structure of the sample. It is the region depicted on the left side of the diagram, i.e. the range with the lowest strain values. For evaluation, the curve of the G' function is often preferred by users. In the LVE region, this function shows a constant value, the so-called plateau value. The limiting value of the LVE region, also called the linearity limit, is determined with a ruler, an analysis software program, or the data table. The linearity limit is first calculated in terms of the strain γL as a percentage.
The user can either select the tolerance range of deviation for G' around the plateau value or leave it up to the analysis software; for example ±5 % deviation (according to the standards ISO 6721-10 and EN/DIN EN 14770) or ±10 % deviation (according to ASTM D7175 and DIN 51810-2).
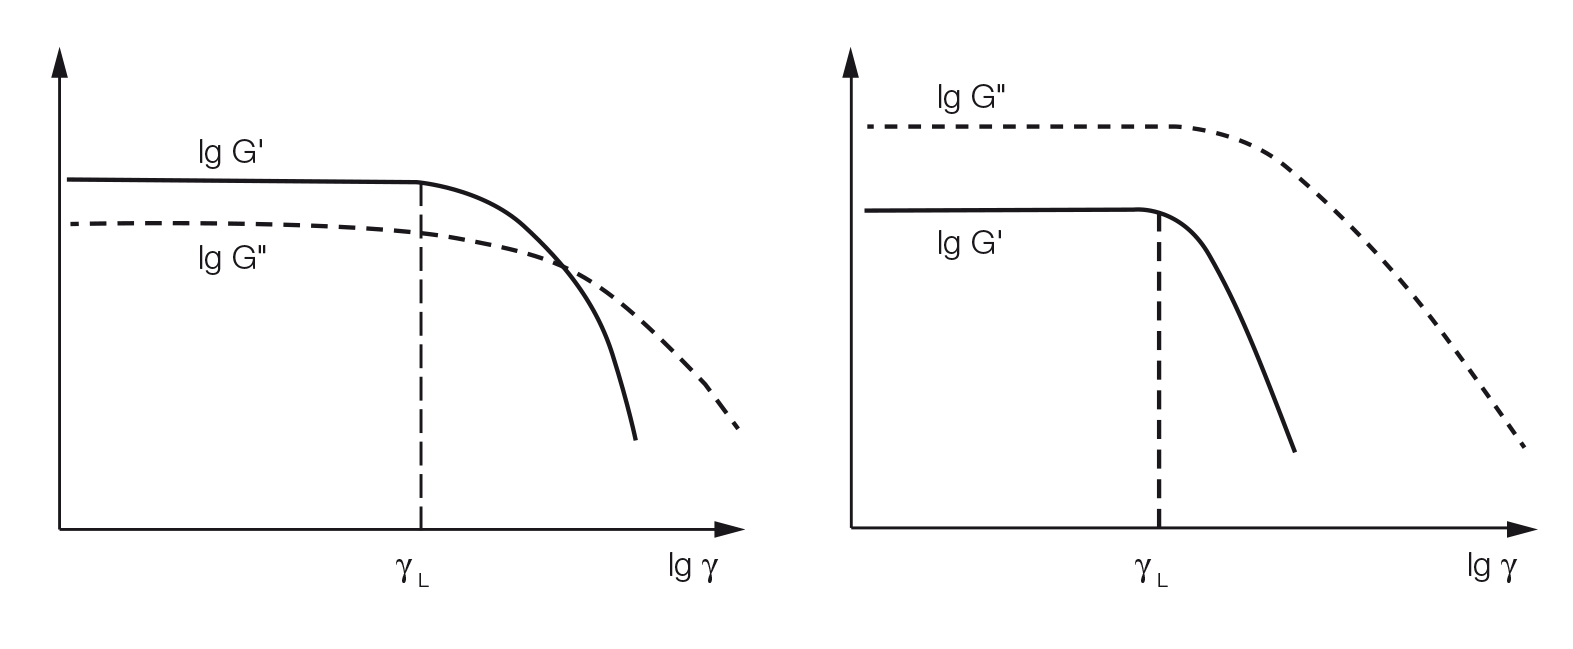
In addition, the values of G' and G'' in the LVE region are also often evaluated. This indicates the viscoelastic character of the sample. If G' > G'', then the sample shows a gel-like or solid structure and can be termed a viscoelastic solid material. However, if G'' > G', the sample displays a fluid structure and can be termed a viscoelastic liquid. Of course, this is only valid for the measuring conditions applied, which means for the preset (angular) frequency. For all subsequent oscillatory tests, it is usually required that the measurements are carried out at strain or stress levels within the LVE region. In general, the following holds: When examining an unknown sample by an oscillatory test, an amplitude sweep must first be carried out in order to determine the limit of the LVE region.
Evaluation of the G' curves
Starting from almost the same initial value in the LVE region, the curve of S1 shows a sharp downturn at γ = 20 %; i.e., the limit of the LVE region, thus indicating brittle fracturing behavior. This means that gel S1 under shear does not break homogeneously but rather into larger pieces. This explains the non-creamy behavior of S1. In contrast, the curve of the G' function of S2 drops continuously after leaving the LVE region, thus indicating a gradual breakdown of the superstructure. This explains the creamy behavior of S2. In practice, G' values in the LVE region represent the stiffness of the sample or the gel strength.
Evaluation of the G'' curves
-->
Evaluation of the G'' curves
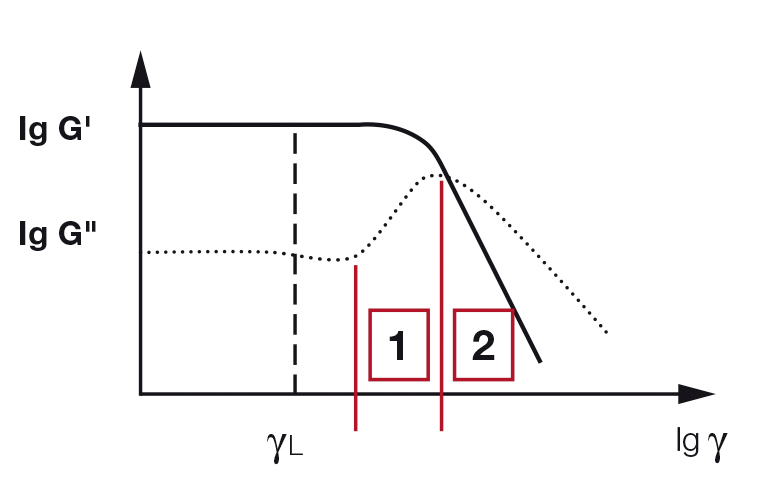
Following an almost constant value in the LVE region for gel S1, the curve rises sharply until, after reaching a distinct peak (maximum), the curve again drops steeply. The values of the loss modulus G'' describe the portion of the deformation energy that is lost by internal friction during shearing. Before the breakdown of the gel has reached the point where it finally starts to flow, it is only at first that a few individual bonds in the network of forces rupture, while the entire surrounding material still keeps firmly together. This means that G' still dominates over G'' throughout the entire sample. At first, micro cracks start to develop. Deformation energy is lost because the broken, freely movable bridge fragments around the micro cracks, which are no longer integrated within the network, start to show internal viscous friction and thus convert deformation energy into friction heat.
When the individual micro cracks grow further, they eventually form a continous macro crack that runs through the entire sample, or the entire shear gap of the measuring system. If this happens, the viscous behavior of the sample dominates and the entire material will start to flow. After exceeding this point, G'' is greater than G' because the crossover point G' = G'' has been exceeded. Often the crossover point and the G'' maximum are very close, in fact they frequently appear at the same deformation value. The shape of the G'' curve at the point where it leaves the LVE region can be used to distinguish the behavior of gels: the maximum for gel S2 is less pronounced than that for S1, and the transition of S2 from the solid state at rest to flowing is less sharp, as can also be seen from the shape of the G'' curve. If, in the LVE region, G' is greater than G'', and if the G'' curve has a distinct maximum at a higher strain value, the following can be stated:
- At the beginning of the test, the superstructure formed a consistent, three-dimensional network.
- The breakdown of the structure started with some micro cracks, although at that time the elastic portion of the viscoelastic behavior still prevailed (region 1 in Figure 3). Therefore, the process of structural breakdown took place with some delay. As the strain increased, a macro crack finally ruptured the entire sample. Only then did the viscous portion of the viscoelastic behavior prevail (region 2 in Figure 3).
Yield point and flow point
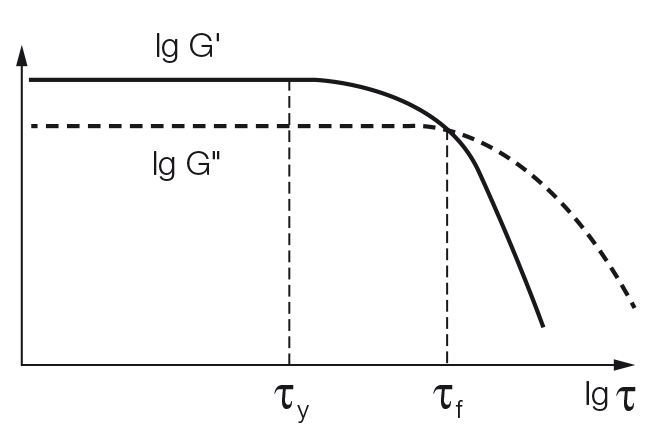
Amplitude sweeps can also be used for determining the yield point and the flow point. No matter whether the test was performed as a strain sweep (with controlled shear deformation) or a stress sweep (with controlled shear stress), the following values are determined by either using the data table or a diagram with the shear stress τ plotted on the x-axis (Figure 4):
- The yield point τy – sometimes also called yield stress – is the value of the shear stress at the limit of the LVE region. The verb “to yield” in this context means to give way or to soften, for example under shear. This point is also called the linearity limit.
- The flow point τf – sometimes also called flow stress – is the value of the shear stress at the crossover point G' = G''. At higher shear, the viscous portion will dominate and the sample flows. Both values are dependent on the measuring conditions, for example on the preset (angular) frequency.
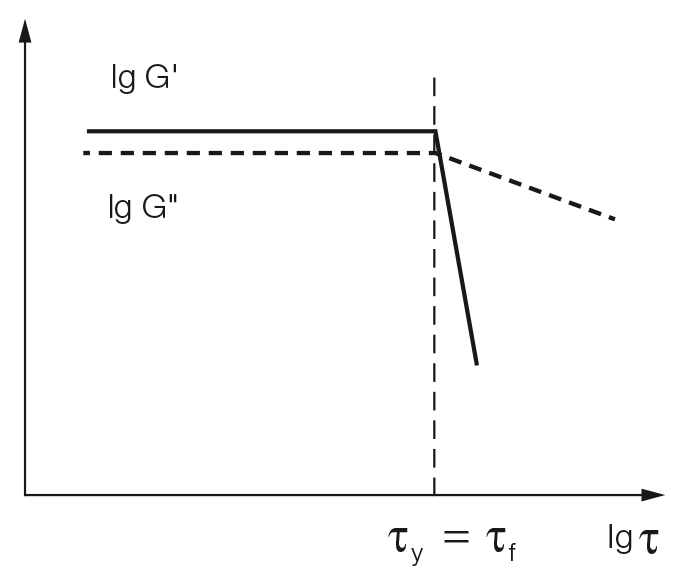
In the region between yield point and flow point, G' > G''. Within this yield zone, the initial structural strength of the LVE region has already decreased but the sample still predominantly displays the properties of solid matter or a gel. For evaluation of the transition behavior from the LVE region to the state of flow, the flow transition index τf / τy can be calculated. If τf = τy then this index has the value 1. The more closely this ratio approaches 1, the higher is the tendency of the sample to brittle fracturing (Figure 5).
Conclusion
If a sample shows G'' > G' in the LVE region, and therefore the character of a fluid, it may have a yield point but not a flow point because it is always liquid.