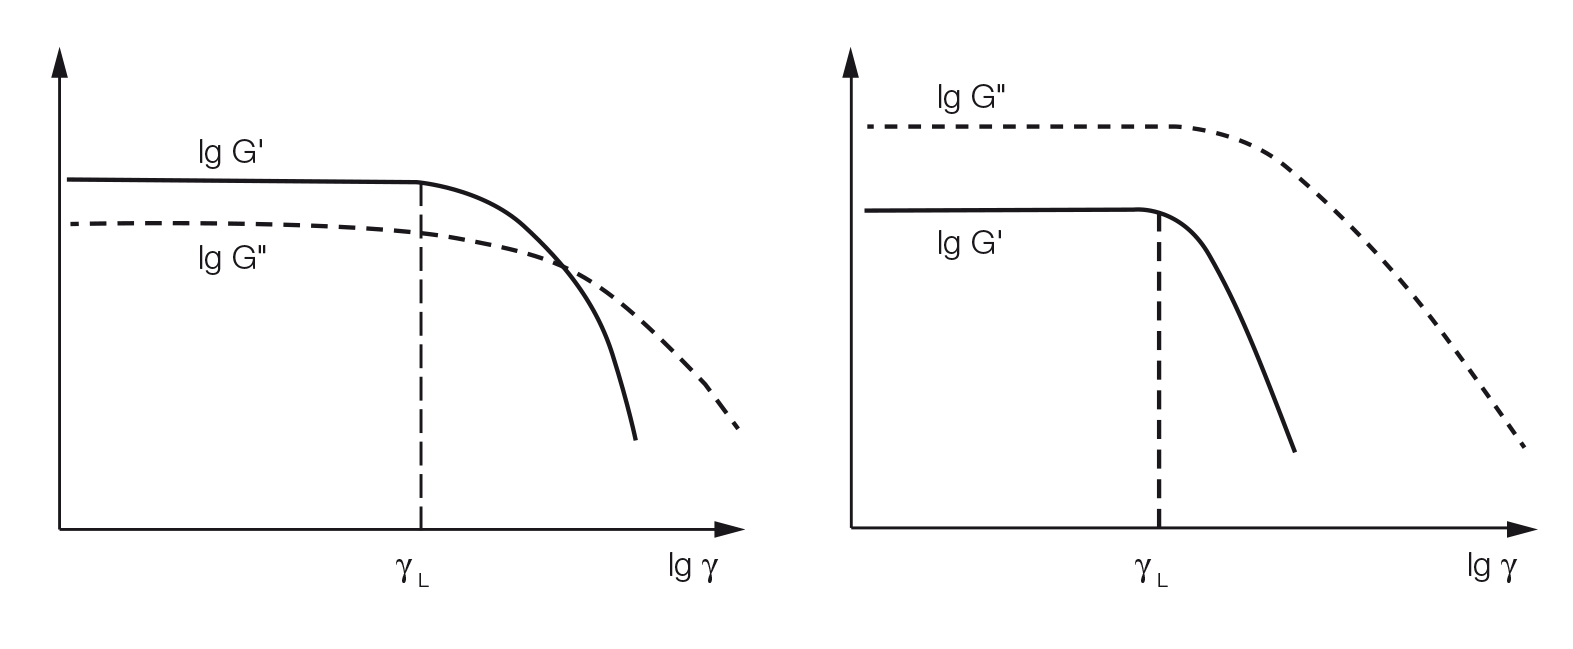
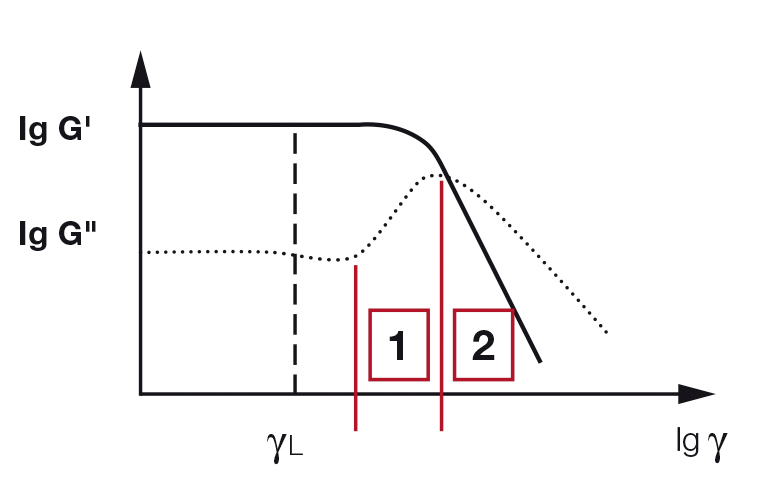
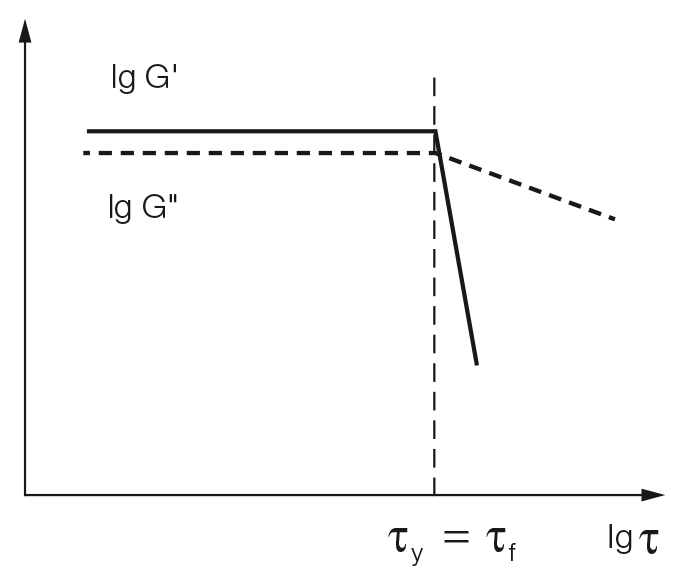
Following an almost constant value in the LVE region for gel S1, the curve rises sharply until, after reaching a distinct peak (maximum), the curve again drops steeply. The values of the loss modulus G'' describe the portion of the deformation energy that is lost by internal friction during shearing. Before the breakdown of the gel has reached the point where it finally starts to flow, it is only at first that a few individual bonds in the network of forces rupture, while the entire surrounding material still keeps firmly together. This means that G' still dominates over G'' throughout the entire sample. At first, micro cracks start to develop. Deformation energy is lost because the broken, freely movable bridge fragments around the micro cracks, which are no longer integrated within the network, start to show internal viscous friction and thus convert deformation energy into friction heat.
When the individual micro cracks grow further, they eventually form a continous macro crack that runs through the entire sample, or the entire shear gap of the measuring system. If this happens, the viscous behavior of the sample dominates and the entire material will start to flow. After exceeding this point, G'' is greater than G' because the crossover point G' = G'' has been exceeded. Often the crossover point and the G'' maximum are very close, in fact they frequently appear at the same deformation value. The shape of the G'' curve at the point where it leaves the LVE region can be used to distinguish the behavior of gels: the maximum for gel S2 is less pronounced than that for S1, and the transition of S2 from the solid state at rest to flowing is less sharp, as can also be seen from the shape of the G'' curve. If, in the LVE region, G' is greater than G'', and if the G'' curve has a distinct maximum at a higher strain value, the following can be stated:
- At the beginning of the test, the superstructure formed a consistent, three-dimensional network.
- The breakdown of the structure started with some micro cracks, although at that time the elastic portion of the viscoelastic behavior still prevailed (region 1 in Figure 3). Therefore, the process of structural breakdown took place with some delay. As the strain increased, a macro crack finally ruptured the entire sample. Only then did the viscous portion of the viscoelastic behavior prevail (region 2 in Figure 3).