Interfacial rheology
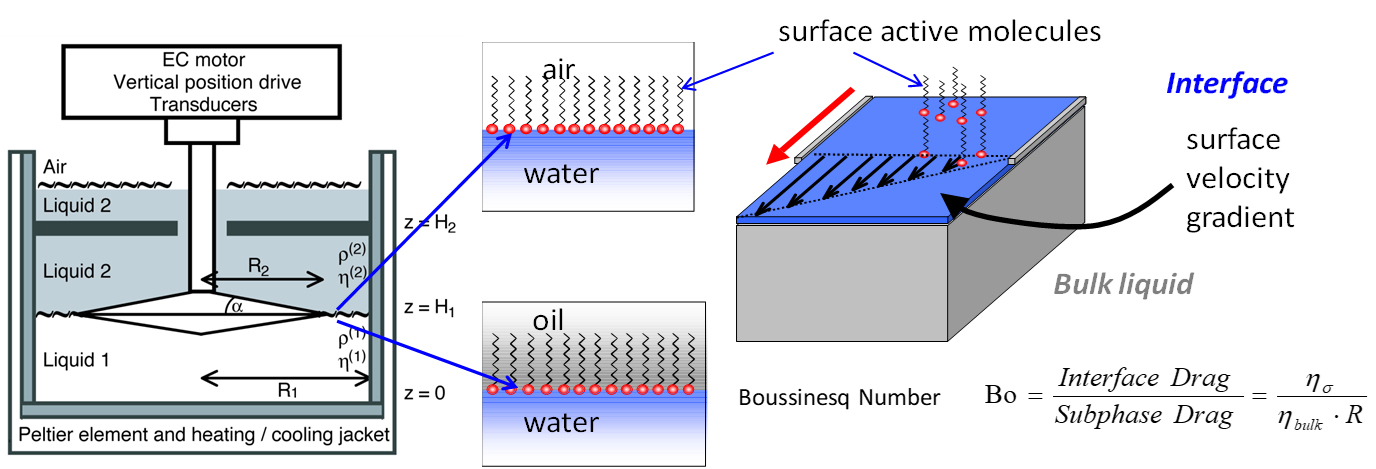
An interface is the contact area of two immiscible phases (e.g., water-oil interface). The interfacial rheology system (IRS) is used to measure the rheological properties of an interfacial layer between two liquids or between a liquid and a gas, such as air. It allows the study of the effects of different surfactants on the stability of the layer (e.g., the formulation of emulsions or foams, or the stability of droplets) and supports rheological measurements of the weakest interfacial structures.
Background
Combined with an MCR rheometer, the IRS permits so-called two-dimensional rheological measurements of interfacial films at the air/liquid and liquid/liquid interfaces.
In these measurements, shear stress is expressed as interfacial shear stress τs in [τs] = Pa·m. Viscosity becomes an interfacial shear viscosity ηs with the relationship: τs = ηs · γ. The interfacial shear viscosity is measured in [ηs] = Pa·s·m = N·s/m or in surface poise.
A specific measuring system is placed at the interface and measures absorbed or spread films (e.g., films produced by proteins or surfactants).
The two main measuring geometries used in interfacial rheology are:
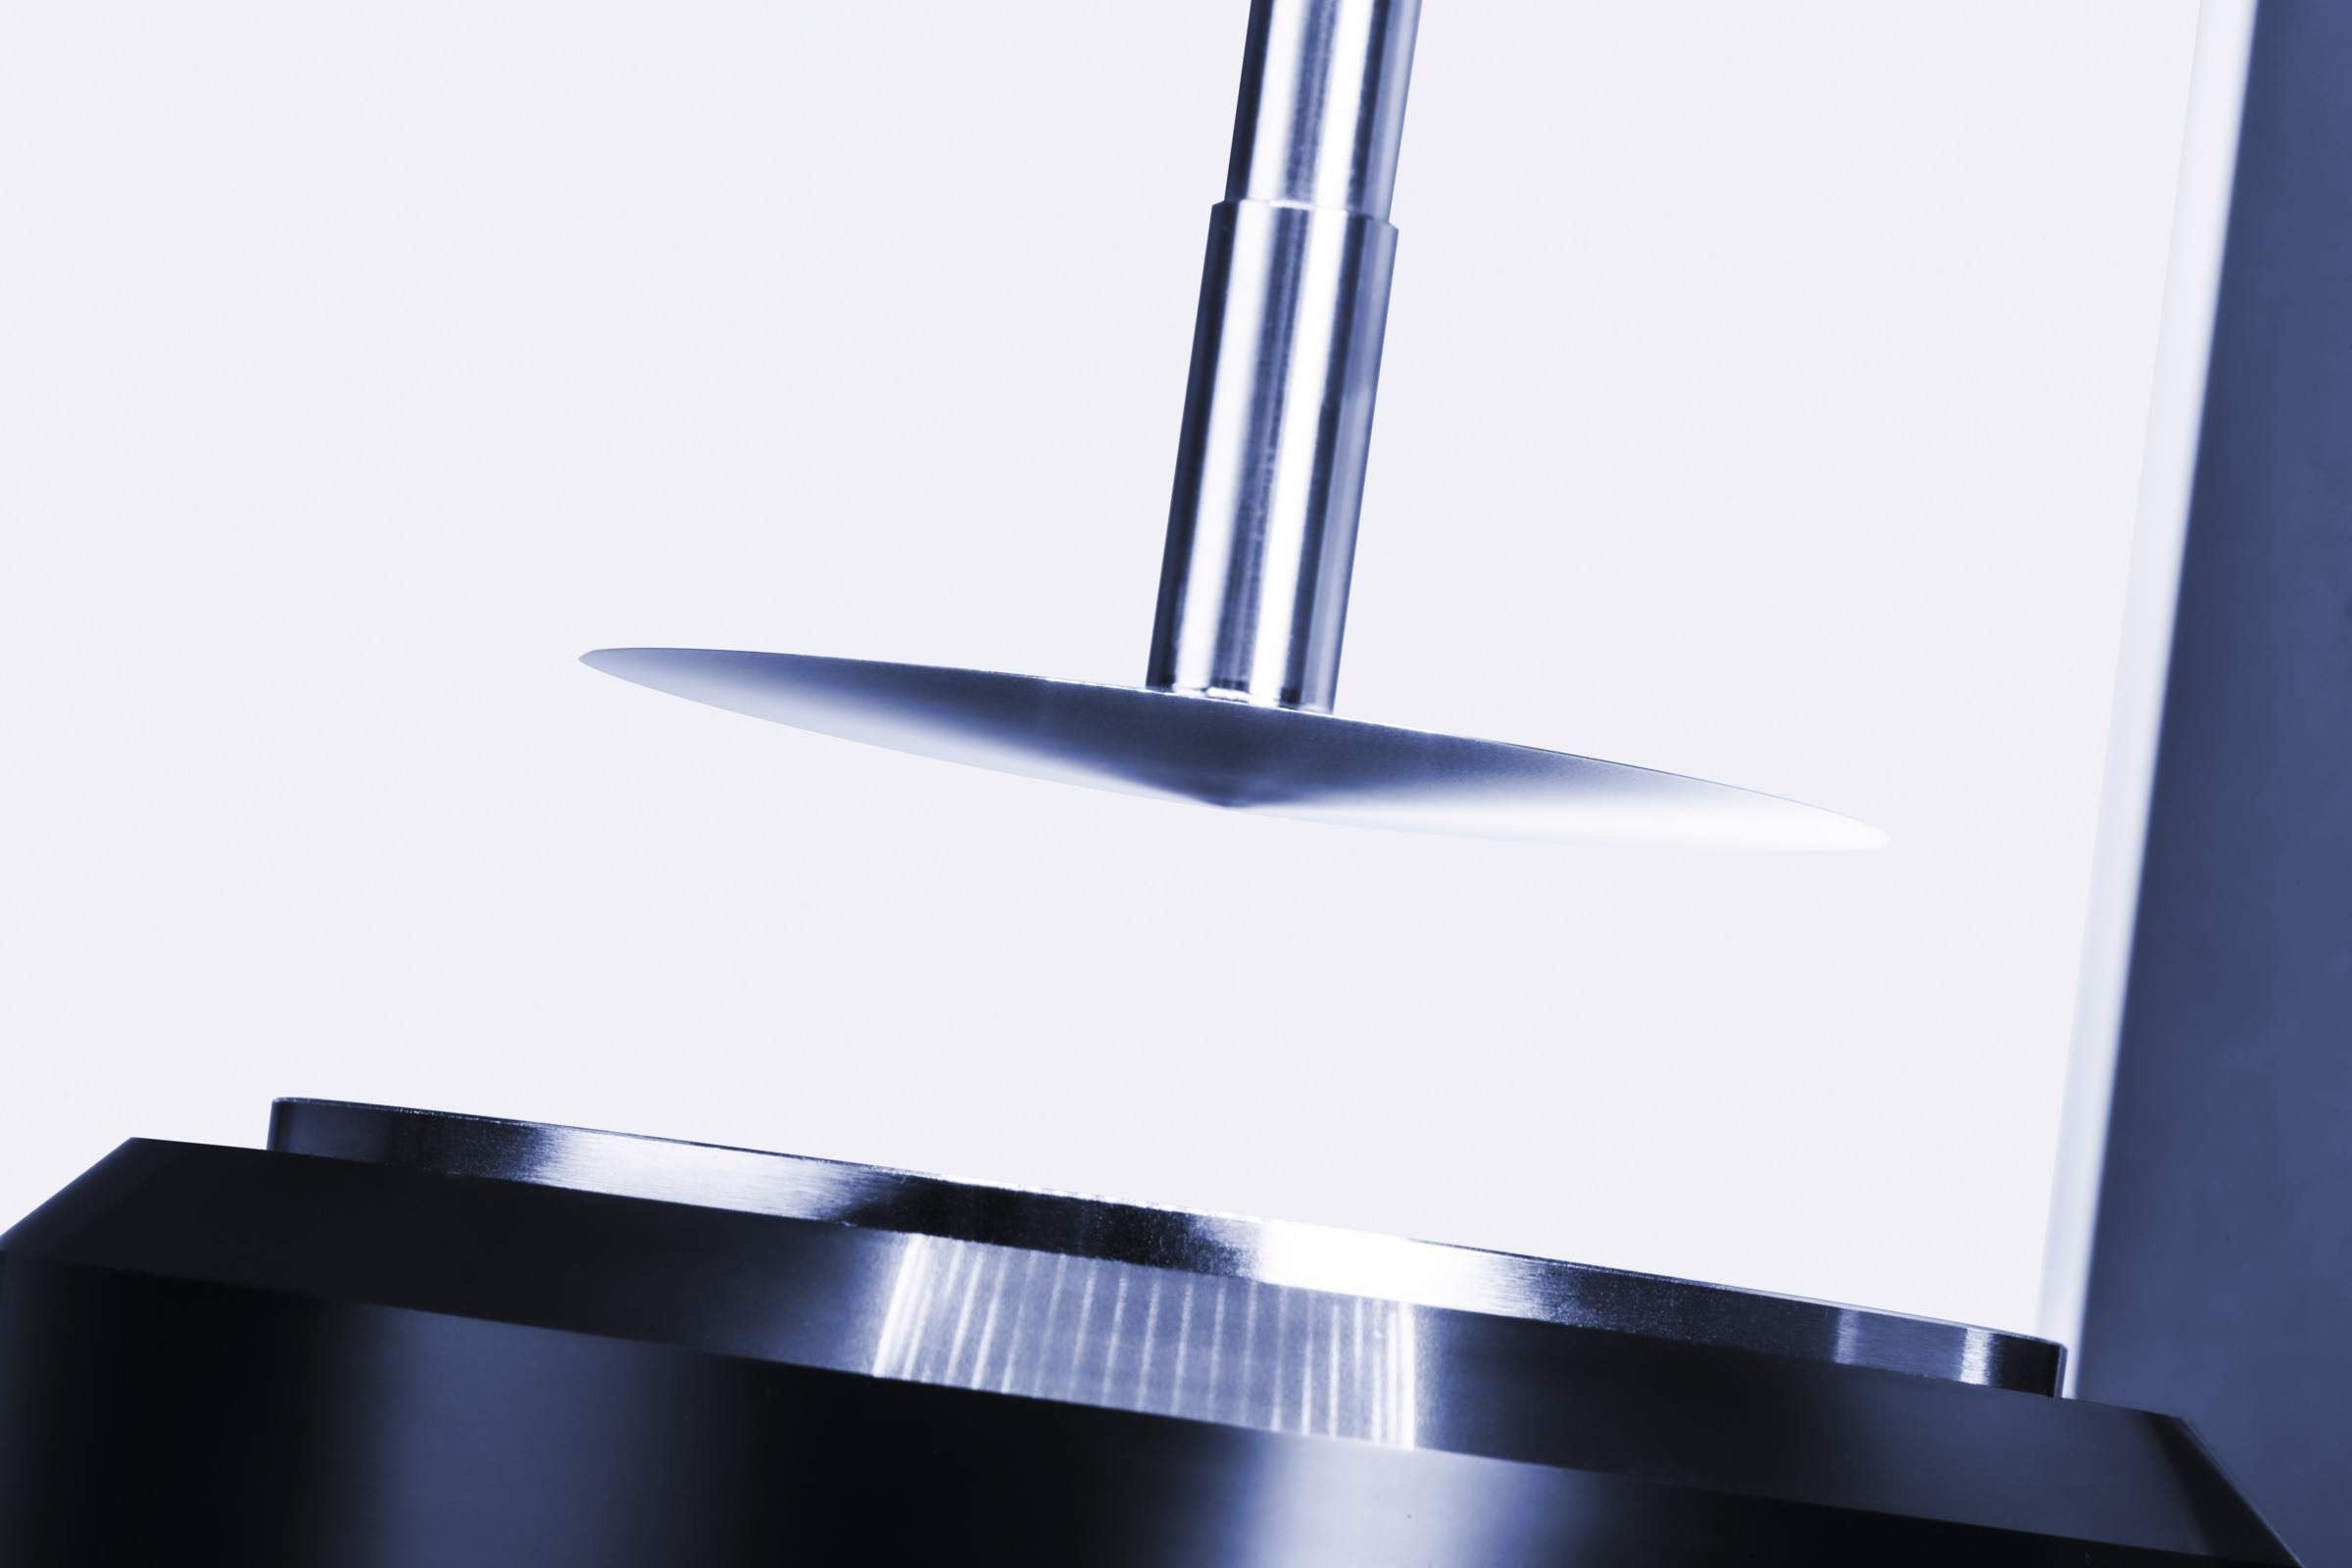
- Bi-cone geometry
- Measurement of liquid-liquid (water-oil) interfaces and water-gas (air) interfaces
- Defined shear field
- Measurement of high viscosities
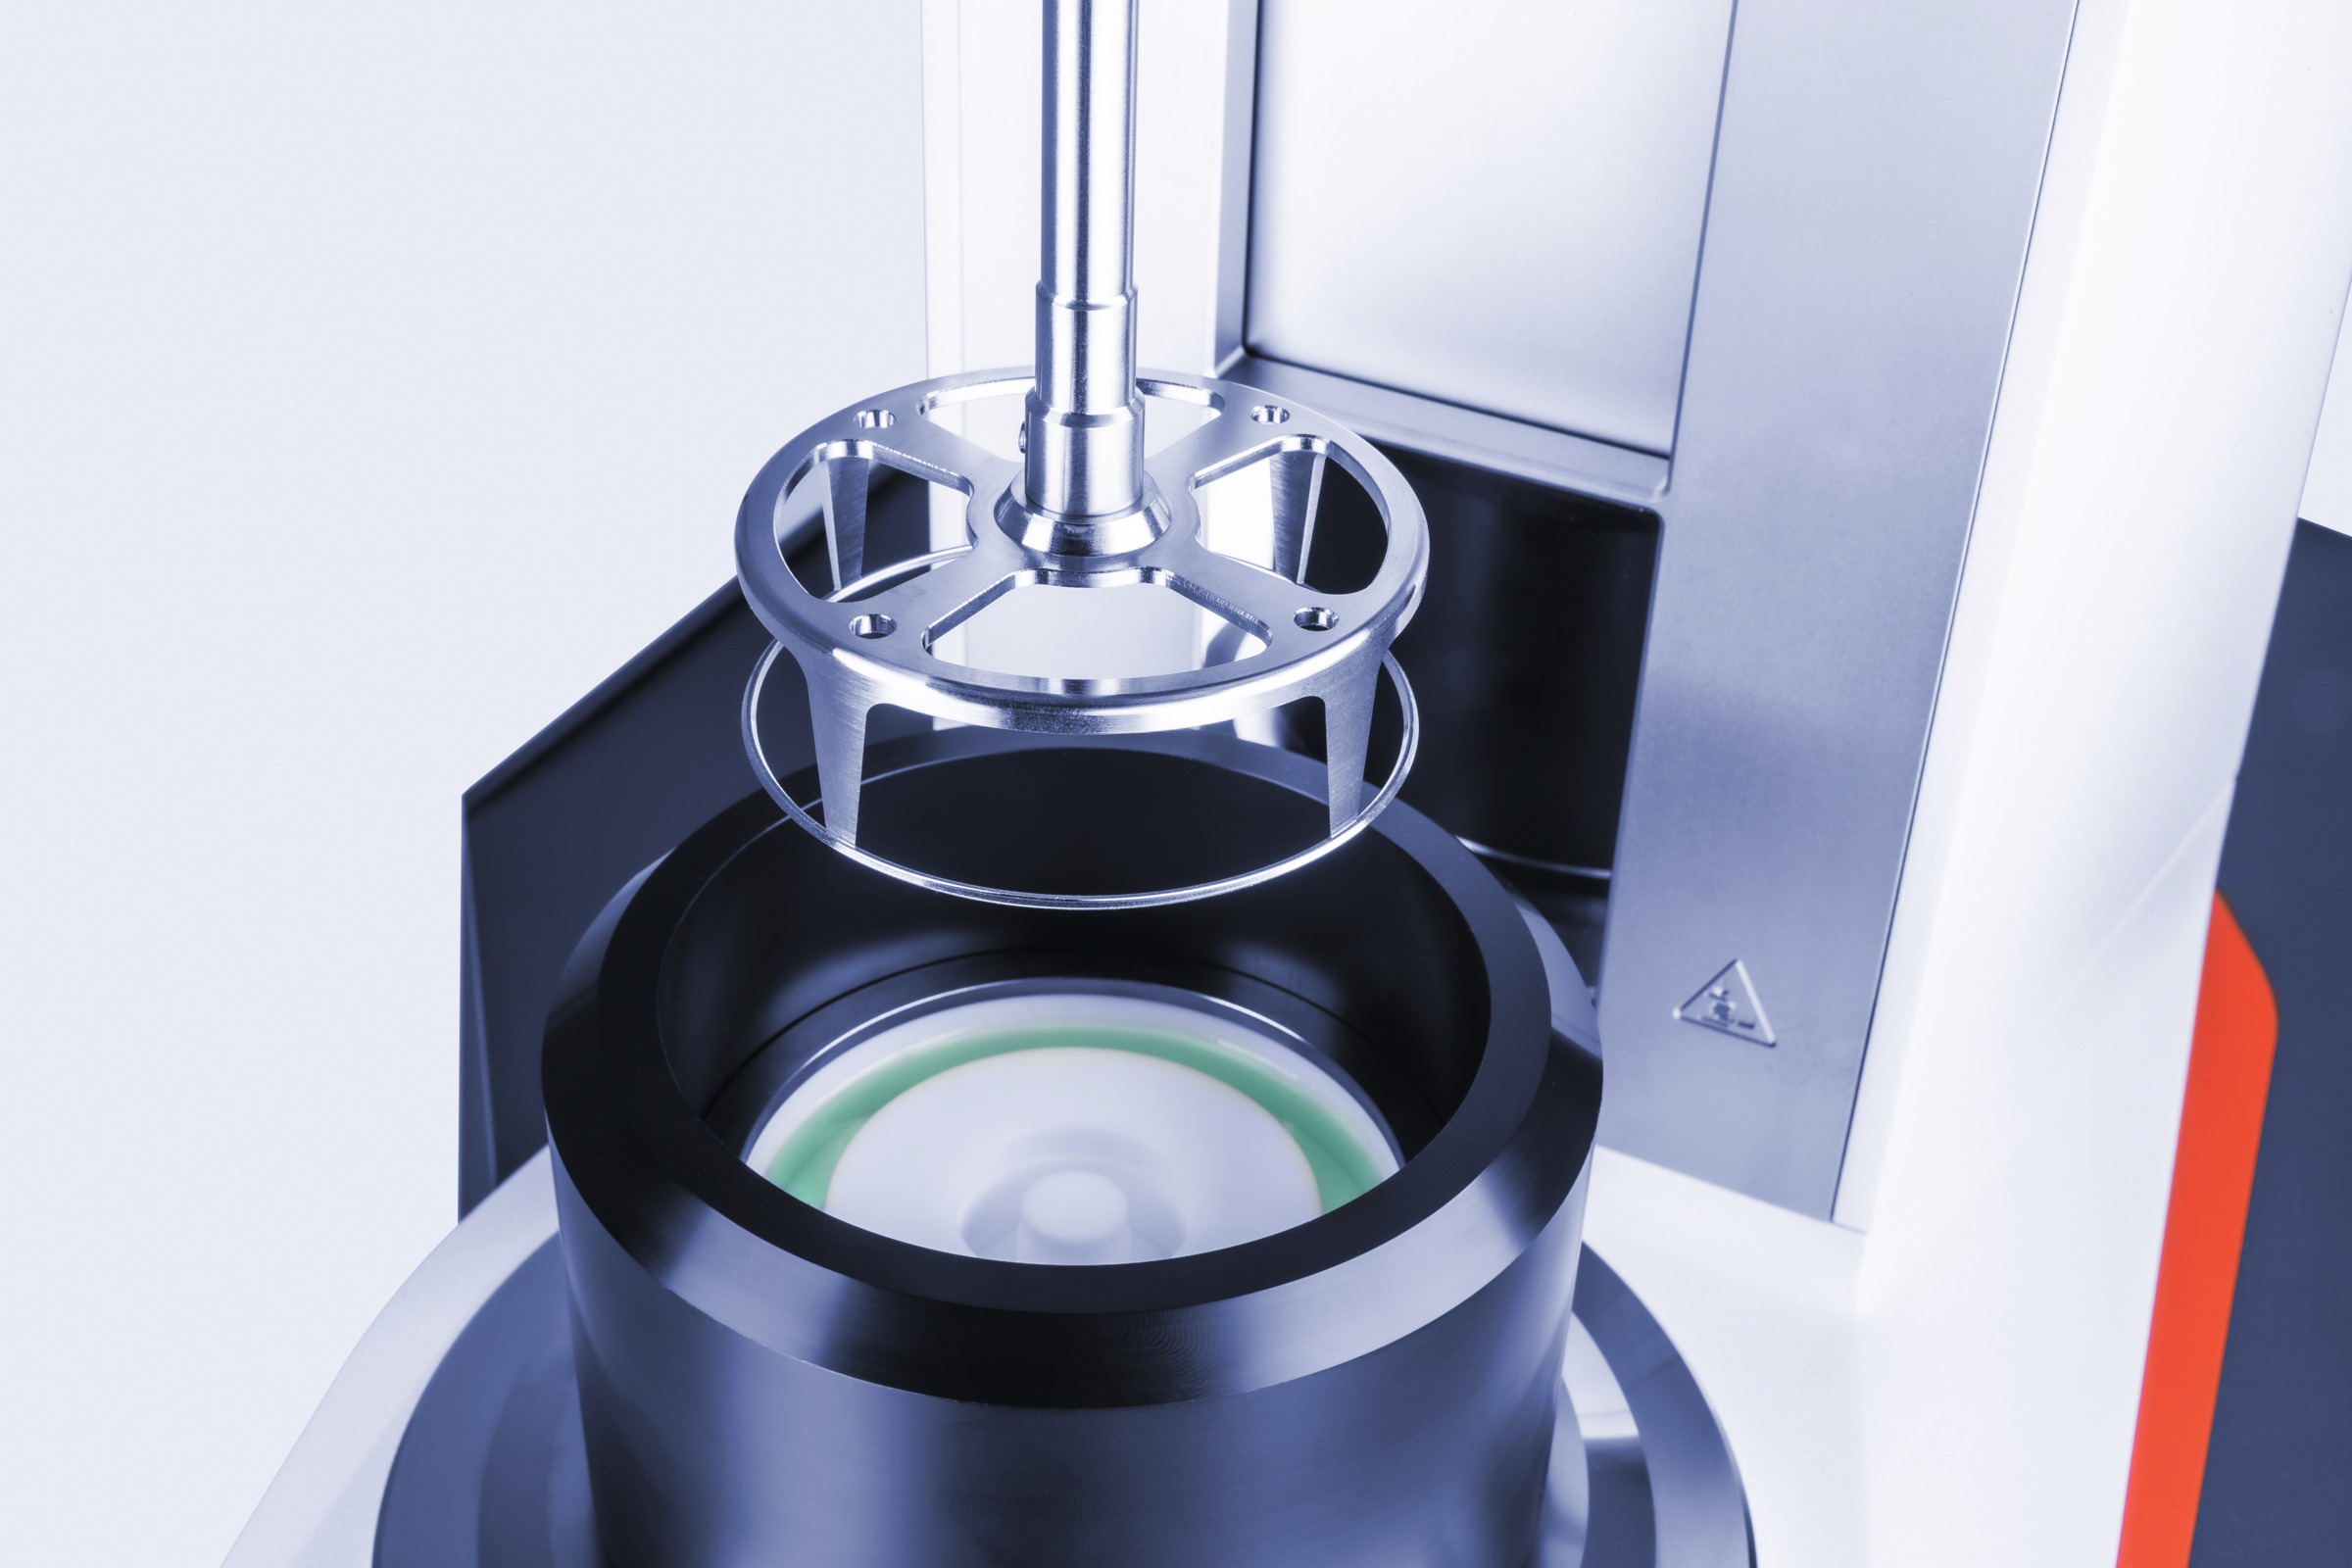
- Double-wall ring (DWR)
- Measurement of liquid-gas (air) interfaces; measurement of liquid-liquid (water-oil) interfaces is possible with limitations
- Defined shear field
- Low influence of the subphase (high Boussinesq number)
Please note: Interfacial shear rheology only makes sense if a film is present. There are two general methods for creating interfacial films: spreading or absorption.
Spread films (mainly for low-molecular-weight surfactants) can be created by:
- Dissolution in a spreading solvent (e.g., hexane, ethanol, chloroform)
- Spreading directly onto the water with a micro-syringe
- Waiting for complete evaporation of the solvent
- Pouring the oil phase on top of the surfactant film
Absorbed films (e.g., for interfacial layers of protein) are created by absorption from the bulk phase to the interface. This can be achieved by:
- Dissolving the proteins in distilled water
- Pouring the oil phase gently on top of the water/protein solution
The IRS, as a combination of MCR and bi-cone or DWR geometry, enables interfacial rheological measurements of the weakest interfacial structures. Additionally, with a bi-cone geometry, high interfacial viscosities can be measured.
Raw data are produced using well-known standard rheological tests, and the interfacial properties can then be calculated from these data. Post-processing hydrodynamic flow-field analysis subtracts the contribution of the bulk and covering phase and calculates the relevant interfacial properties of the measured interfacial layer. Measurements can be performed in rotational and oscillatory modes, e.g., allowing flow curves and creep tests at an interfacial layer or oscillatory tests during film formation processes.
The temperature is controlled via Peltier elements over a range of 5 °C to 70 °C; the patented normal force sensor in the air bearing of the MCR rheometer allows the accurate positioning of any geometry used in the interface.
Typical tests in interfacial rheology that can be performed are:
- Time tests to follow interfacial film formation
- Flow curves
- Amplitude sweeps
- Frequency sweeps
Typical applications:
- Food: Emulsions and foams
- Consumer products: Emulsions, foam, and surfactants
- Pharmaceuticals: Encapsulation and drug release
- Oil industry products: Surfactants, drag reducers, and water-oil systems
- Langmuir monolayers: Films at the water-air interface
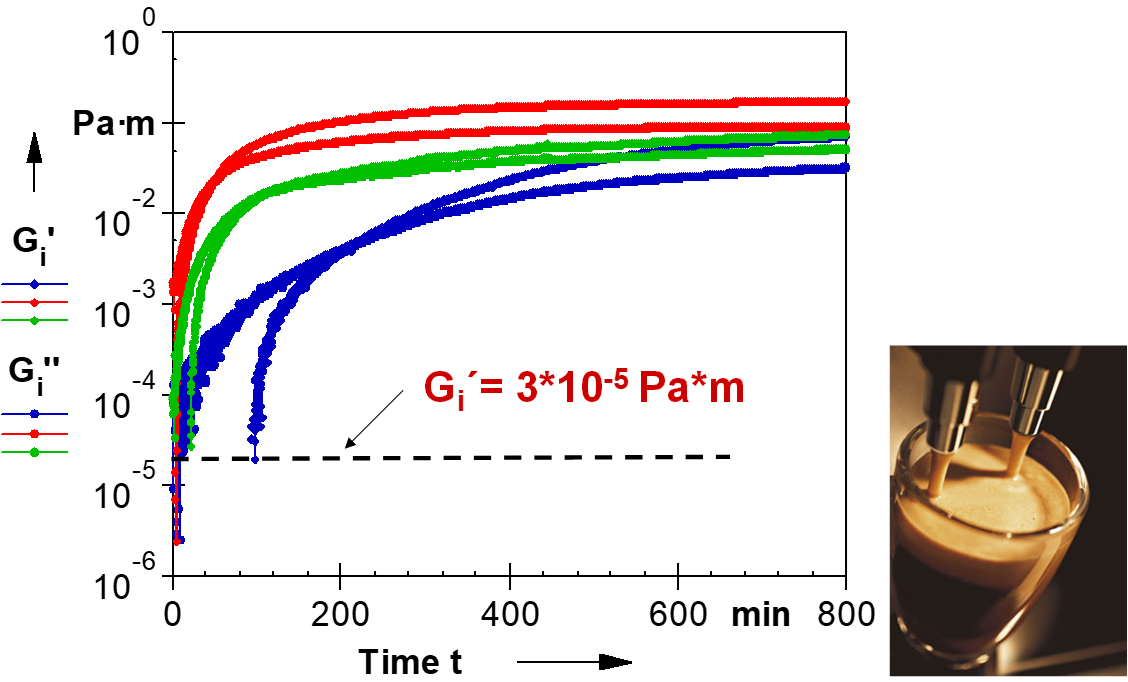
Measurement example
The following figure illustrates a representative measurement investigating interfacial rheological properties of coffee crema. It shows the film formation for the same coffee sample at three different concentrations. When measuring at constant strain and constant frequency, it is possible to follow the adsorption and network formation of the surface-active ingredients at the liquid/air interface. For higher concentrations, the film shows elasticity after a shorter time. In the case of the lowest concentration, the moduli increase over a longer time and still haven’t reached plateau values at the end of the experiment. This indicates that the higher the concentration of the coffee powder, the faster the film formation.