Basics of FTIR spectroscopy
Fourier transform infrared (FTIR) spectroscopy is one of the most versatile methods for finding out what a material is made of. It measures how a sample absorbs mid-infrared light and turns that information into a spectrum. Because molecular bonds vibrate at characteristic energies, the spectrum acts like a chemical fingerprint and can be used for identification, comparison, and quantitative analysis. FTIR is widely used because it is fast, information-rich, and applicable to solids, liquids, powders and gases.[1]
What is FTIR spectroscopy?
Infrared spectroscopy is the study of the interaction of infrared light with matter. It is based on the ability of almost all molecules to absorb infrared radiation at specific wavelengths. Each molecule has characteristic absorption properties, which are often linked to its functional groups. These absorption features can be used like a "fingerprint" to identify substances. An infrared spectrometer measures these absorptions and produces an infrared spectrum, which can be used for identifying and determining the structure of chemical compounds.[6]
In routine work, the most important region is the mid-infrared, typically from 4,000 to 400 cm⁻¹.
![Figure 1: Electromagnetic spectrum: Depending on the energy of the electromagnetic radiation, different vibrations in the sample are induced.[11]](https://wiki.anton-paar.com/fileadmin/_processed_/5/2/csm_raman_spec4_6197d1feee.jpg)
Fourier transform infrared spectroscopy (FTIR) is the dominant form of infrared spectroscopy, having replaced dispersive spectrometers in recent years due to its combination of speed, good sensitivity, and excellent wavenumber precision.[1]
Properties of light
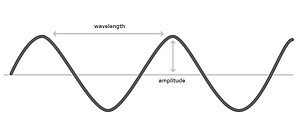
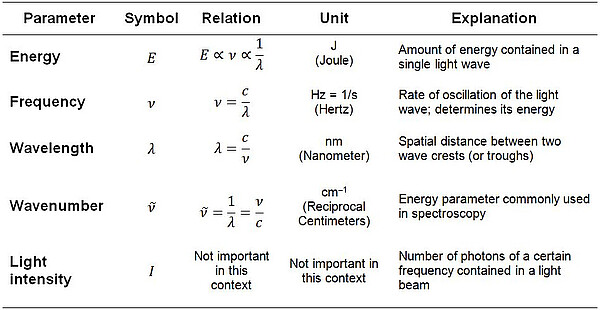
Light is a form of electromagnetic radiation, which has both wave and particle (“photon”) properties. Light waves are usually mathematically described by a cosine function, where the two most important characteristic parameters are the wavelength (distance between two consecutive wave crests or troughs) and the amplitude (height of the waves over the baseline).
For a detailed discussion on this subject, see "What is light – a particle or a wave?"
Electromagnetic radiation propagates through space carrying a certain amount of electromagnetic energy. This energy is proportional to its frequency ν of oscillation, which is connected to the wavelength λ by the speed of light c (Equation 1):
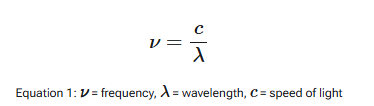
Therefore, a light wave (or photon) carries more energy E the larger the frequency is or, alternatively, the smaller the wavelength is (Equation 2).
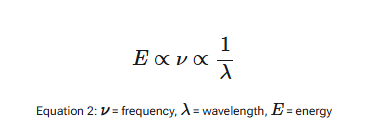
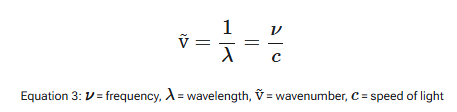
For historical reasons, spectroscopists also like to use the wavenumber ṽ, which is defined as the reciprocal of the wavelength. The wavenumber is directly proportional to the energy of the photon (Equation 3) and usually expressed in units of reciprocal centimeters (cm–1) to give easy-to-read numbers.
The above description is valid for a single light wave or photon. However, a light beam consists of many light waves with different frequencies propagating in the same direction. Each frequency contributes to the beam with intensity I (i.e., a certain number of photons per time interval). The intensity of a light beam is the quantity that is ultimately measured with the detector of a spectrometer.
The intensity distribution of all frequencies is the spectrum of the light beam. Only a small part of the light frequencies can be seen by the human eye (“visible light”). Other spectral regions include microwave, infrared, ultraviolet (UV), or Röntgen (X-ray) radiation. For IR spectroscopy, infrared (IR) light is used for the excitation.[8],[9],[10]
Spectroscopists usually work with wavenumber because it is directly related to energy and gives convenient numbers on the x-axis. By convention, infrared spectra are plotted with high wavenumber on the left and low wavenumber on the right.
What does an FTIR spectrum show?
An infrared spectrum is a plot of measured intensity versus wavenumber. When the spectrum is shown in absorbance, peaks point upward and indicate where the sample absorbed infrared light. When the same data are shown in transmittance, the peaks point downward. For most analytical work, absorbance is preferred because it is the correct basis for quantitative analysis, spectral subtraction, and library searching.
Each peak corresponds to a molecular vibration, belonging to a functional group of the molecule. The overall pattern indicates the chemical structure of a sample. This is why FTIR is often described as a fingerprint method. At the same time, peak height is related to concentration through Lambert–Beer’s law:
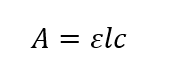
A = absorbance
ε = constant (absorptivity)
l = pathlength
c = concentration
This combination makes FTIR useful not only for identifying materials, but also for measuring how much of a component is present.
How does an FTIR spectrometer work?
An FTIR spectrometer consists of the following components:
- Light source
- Interferometer with beam splitter
- Sample cell
- Detector
- Computer unit for Fast Fourier Transform
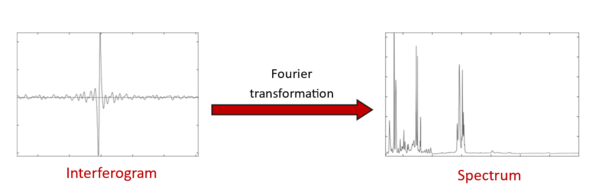
At the heart of every FTIR spectrometer is an interferometer. Instead of separating light wavelength by wavelength with slits and gratings, the beam splitter of the interferometer splits the beam into two paths, changes the optical path difference between them with a moving mirror, and recombines them. Before reaching the detector, the IR light passes through the sample in the sample chamber, where specific molecular vibrations absorb characteristic wavelengths of the radiation. As a result, the transmitted light carries the absorption information of the sample. The detector records the changing signal as an interferogram. A mathematical operation, the Fourier transform, converts that interferogram into the familiar spectrum.
In routine use, the instrument first measures a background spectrum and then a sample spectrum. By ratioing these, most contributions from the instrument and environment are removed, leaving the spectrum of the sample. A built-in laser acts as an internal wavenumber reference, which is one reason FTIR peak positions are highly reproducible.
Such a design ensures that more light reaches the detector, all wavelengths are measured simultaneously, and wavenumber measurements remain precise thanks to the laser reference.
These are the main reasons instruments used for FTIR spectroscopy can outperform older dispersive IR systems in everyday laboratory work.
Why molecules absorb infrared radiation?
In IR spectroscopy, molecular vibrations are excited by the absorption of infrared radiation. This leads to changes in bond lengths and bond angles within a molecule. Two main categories of vibrations are distinguished (see Figure 4)[2]:
Valence vibrations (stretching vibrations): These involve changes in the bond lengths between atoms
- Symmetric stretching: All involved atoms move toward or away from each other at the same time
- Asymmetric stretching: One atom moves toward another, while the other moves away
- Deformation (bending) vibrations: These involve changes in the bond angles.
- Bending vibration: Two atoms move toward or away from each other without changing the bond lengths
- Wagging vibration: The atoms swing back and forth in the same plane
- Rocking vibration: The motion occurs out of the molecular plane
- Twisting vibration: A rotating motion around a bond axis
![Figure 5: Types of vibrations.[6]](https://wiki.anton-paar.com/fileadmin/_processed_/2/5/csm_Figure5_03da5b4aea.jpg)
Number of degrees of freedom
The simplest example of a molecule is a diatomic system such as molecular oxygen (O2), nitrogen (N2), or carbon monoxide (CO). These molecules have only one vibrational degree of freedom along the bond axis, as the two atoms can only move relative to each other along their mutual distance. This motion is called a stretching or valence vibration.[3] In multi-atomic molecules, additional independent vibrational modes are possible due to the presence of more atoms. These are referred to as normal modes. The number of these normal modes depends on the ways in which each atom can move. Each atom has three degrees of freedom, corresponding to movement in the three spatial directions. A molecule with N atoms therefore has a total of 3N degrees of freedom.[3],[4] Since the atoms in a molecule are connected by chemical bonds, they cannot move completely independently. However, the molecule is not rigid, so relative movements between atoms are possible. As a result, the total degrees of freedom of a molecule can be divided as follows[4]:
- Three degrees of freedom correspond to translation (i.e., movement of the entire molecule in the x-, y-, and z-directions)
- Two degrees of freedom (for linear molecules) or three (for non-linear molecules) are used for rotation around spatial axes
- The remaining degrees of freedom are associated with vibrational motion of the atoms within the molecule. This results in linear molecules that have 3N−5 vibrational modes, while bent (non-linear) molecules have 3N−6 vibrational modes.5
An example is the linear carbon dioxide molecule (CO2), which consists of three atoms. It therefore has 3 × 3 − 5 = 4 vibrational modes, including the symmetric and asymmetric stretching vibrations, as well as two bending vibrations, one in the plane and one out of the plane of the diagram. In contrast, the bent water molecule (H2O) also consists of three atoms but has 3 × 3 − 6 = 3 vibrational modes.
Types of vibrations and their effects on the absorption region
The carbonyl group is a common functional group in chemistry that, due to its permanent dipole moment, gives rise to very distinctive bands caused by the stretching vibration of the C=O bond. The wavenumber of this band (or bands) is strongly influenced by the chemical environment of the carbonyl group. Delocalization effects can alter the bond strength of the C=O bond, resulting in a shift of the IR band. Typical wavenumber ranges for various functional groups can be seen in Table 2 and Figure 6.[9]
| ν̃ [cm−1] | Vibration |
| 3,600–2,500 | O–H stretching vibration N–H stretching vibration C–H stretching vibration |
| 2,500–1,900 | C≡C stretching vibration C≡N stretching vibration X=Y=Z stretching vibration |
| 1,900–1,400 | C=C stretching vibration C=O stretching vibration C=N stretching vibration N=O stretching vibration N–H bending vibration |
| 1,400–400 | Fingerprint region |
Table 2: Overview of important vibrations.[9]
![Figure 6: Typical wavenumber ranges of various functional groups.[2],[7]](https://wiki.anton-paar.com/fileadmin/_processed_/c/8/csm_image14_632dedd837.png)
What determines spectral quality?
A good FTIR spectrum is more than a collection of peaks. It should also have a flat baseline, appropriate peak height, low noise, and as few artifacts as possible. Two settings matter especially: resolution and number of scans.
Resolution
Resolution describes how well closely spaced peaks can be separated. Higher resolution reveals more detail, but it also makes spectra noisier and increases measurement time. As a practical rule, solids and liquids are commonly measured at 8 cm⁻¹ or 4 cm⁻¹, while gases often require 2 cm⁻¹ or better because their bands are much sharper.
Number of scans
Signal-to-noise ratio improves roughly with the square root of the number of scans. That means collecting more scans can make weak peaks easier to see, although the improvement becomes less dramatic over time. In daily work, this is one of the simplest ways to improve a marginal spectrum.
Common artifacts
The most familiar FTIR artifacts are water vapor and carbon dioxide. Because background and sample are measured at different times, small changes in the atmosphere inside the instrument can leave extra gas bands in the final spectrum. These may point upward or downward depending on whether the gas concentration increased or decreased between the two measurements.[1]
Sampling methods in FTIR
A major advantage of FTIR spectroscopy is that little sample preparation is needed for routine sampling methods.
The three main sampling methods are:
- Transmission
- Attenuated total reflectance (ATR)
- Specular reflectance and diffuse reflectance infrared Fourier transform spectroscopy (DRIFTS)
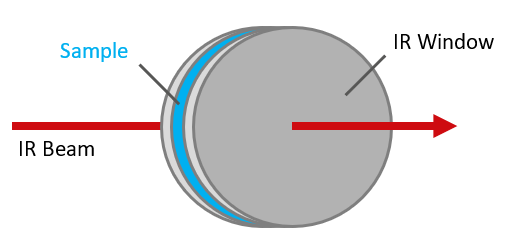
Transmission
Transmission methods are widely trusted because they can produce excellent spectra with flat baselines and clear bands. They are also broadly applicable. However, their main limitation is the opacity problem: The sample must be thin enough, or diluted enough, so that it absorbs neither too little nor too much light.
Solids are often pressed into KBr pellets while liquids are filled into transmission cells with pathlengths ranging from 25 µm to 200 µm. Gases require dedicated gas cells with much longer pathlengths ranging from 5 cm to 20 m.[1]
ATR
Attenuated total reflectance (ATR) has become the most popular general-purpose FTIR sampling method because it allows measurements of solids, powders, and liquids, and does not require sample preparation.
In ATR, the infrared beam undergoes internal reflection inside a crystal, creating an evanescent wave that penetrates only a few micrometers into the sample.
Diamond ATR is highly versatile because diamond is chemically resistant, mechanically robust, and difficult to scratch. For routine work, measurement with a diamond ATR is often the first technique to try.[6]

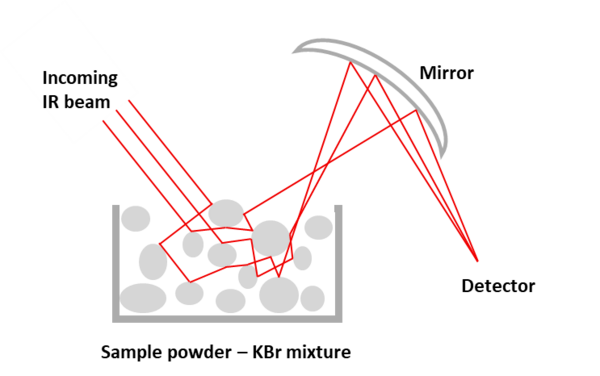
DRIFTS and specular reflectance
For powders and rough solids, diffuse reflectance (DRIFTS) can be useful. For smooth metallic surfaces or coatings on shiny metals, specular reflectance and reflectance-absorbance methods are valuable. These techniques can reduce preparation time, but they are generally more surface-sensitive and can produce noisier spectra than good transmission measurements.
Overall, the most practical rule is simple: For solids, powders, polymers, liquids, and semi-solids, ATR is usually the preferred starting point; for gases, transmission gas cells remain the standard approach.[1]
What is FTIR used for?
FTIR is typically used to answer three kinds of questions.
- Identification: What is this material?
- Verification: Are these two materials the same?
- Quantification: How much of a component is present?
These cover a large part of routine industrial and laboratory practice, from incoming goods inspection to contamination analysis to formulation control.
For quantitative work, FTIR spectroscopy uses calibration references and Beer’s law. Once a suitable calibration has been built, the spectrum of an unknown can be used to predict concentration. In practice, success depends on good band selection, good sample preparation, and stable measurement conditions.
FTIR is also used to monitor chemical changes, compare batches, identify residues, analyze coatings and polymers, and investigate failures.[1]
Strengths and limitations of FTIR
The appeal of FTIR comes from a strong combination of benefits: It is broadly applicable, information-rich, relatively fast, relatively inexpensive compared with many high-end analytical techniques, and sensitive enough for a great deal of routine and advanced work.
However, its limitations are just as important to understand. Some species are not directly detectable in the mid-infrared, including monatomic species and homonuclear diatomic molecules such as N2 or O2. Complex mixtures can be difficult because bands overlap. Atmospheric water vapor and CO2 can introduce artifacts. Finally, the choice of sampling method can strongly shape the quality and interpretability of the result.
Conclusion
FTIR spectroscopy is powerful because it translates a simple physical interaction – the absorption of infrared light by vibrating chemical bonds – into practical chemical information. Once the basics of wavenumber, interferometers, spectral quality, and sampling are understood, FTIR becomes a remarkably efficient tool for everyday analysis. For most routine samples, ATR makes FTIR especially approachable. For gases, demanding quantitative work, or special sample types, transmission and other specialized methods remain essential.
References
[1] Smith, B. C. Fundamentals of Fourier Transform Infrared Spectroscopy, 2nd ed.; CRC Press: Boca Raton, 2011.
[2] Günzler, H.; Gremlich, H.-U. IR-Spektroskopie: eine Einführung, 4., vollständig überarb. und aktualisierte Aufl.; Wiley-VCH GmbH & Co. KGaA: Weinheim, 2003.
[3] Spektrum.de. Freiheitsgrad – Lexikon der Physik. https://www.spektrum.de/lexikon/physik/freiheitsgrad/5308 (accessed 2025-02-05).
[4] Stephan, K.; Mayinger, F. Thermodynamik: Band 2: Mehrstoffsysteme und chemische Reaktionen. Grundlagen und technische Anwendungen, 14. Aufl.; Springer Berlin Heidelberg: Berlin, 1999. https://doi.org/10.1007/978-3-662-10522-1.
[5] Landau, L. D.; Lifšic, E. M.; Sykes, J. B.; Bell, J. S. Mechanics, 3rd rev. and enl. ed.; Course of Theoretical Physics; Pergamon Press: Oxford, 1976.
[6] Mirabella, F. M., Ed.; Internal Reflection Spectroscopy: Theory and Applications; Marcel Dekker: New York, 1993.
[7] Clayden, J.; Greeves, N.; Warren, S. G. Organische Chemie, 2. Aufl.; Glauner, F., Mühle, K., Saal, K. von der, Transl.; Lehrbuch; Springer Spektrum: Berlin, 2017. https://doi.org/10.1007/978-3-642-34716-0.
[8] Hollas, J. M. Modern Spectroscopy, 4th ed.; John Wiley & Sons: Chichester, 2004.
[9] Long, D. A. The Raman Effect: A Unified Treatment of the Theory of Raman Scattering by Molecules; John Wiley & Sons: Chichester, 2002.
[10] McCreery, R. L. Raman Spectroscopy for Chemical Analysis; John Wiley & Sons: New York, 2000.
[11] Britannica Editors. Electromagnetic Spectrum. Encyclopedia Britannica. https://www.britannica.com/science/electromagnetic-spectrum (accessed 2026-03-30).